We believe in diversification
”Diversification is a safety factor that is essential because we should be humble enough to admit we can be wrong.” Sir John Templeton
– aka ‘The Father of International Investing.’
The more a particular stock, equity market sector, market segment outperforms, the more likely it is to draw favorable interest from investors and corresponding investment flows. The reverse is also true. Securities that underperform, lose investor support and confidence and tend to stagnate. It is hard to know when the waxing and waning will begin and end, but we are confident that cycles of investor enthusiasm and disdain lie ahead. Below is a table that shows various developed country indices by decade. As you can see, in several decades, the performance of the U.S. (e.g., S&P 500) was near the top of the leader board and in others where it was decidedly near the bottom. The spread between the best and the worst is high in many decades.
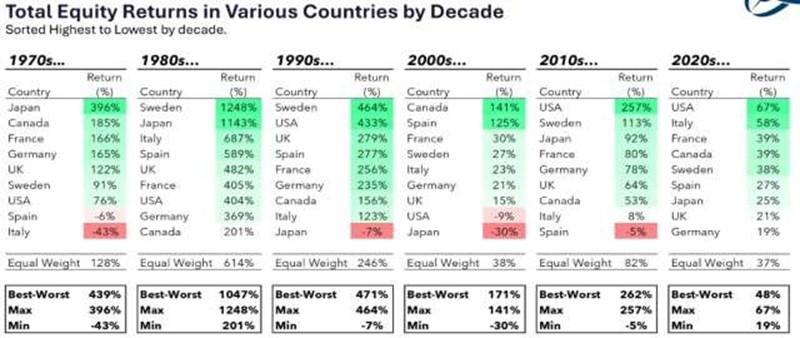
Source: Ritholtz Wealth Management and MSCI. All country returns are MSCI, U.S. is the S&P 500
As the table above shows, in 3 of the 5 full decades (e.g., the ‘70s, ‘80s, ‘00s), the S&P 500 was near the bottom. In the ‘90s, ‘10s and thus far this decade it is at or near the top. Leadership in 1 let alone 2 decades often precedes sustained periods of underperformance and vice versa. In hindsight, we know that often the period of top performance happens when valuations travel from low to high. Conversely when performance is poor (at least on a relative basis) it is often because valuation metrics (e.g., the PE ratio) decline significantly. To the extent investors pile in near the top, or aggressively sell near the bottom, they likely base their decisions on price movement with little appreciation for valuation. By asking the second level question, ‘To what degree is the favorable/(unfavorable) news priced in?’, investors can potentially avoid the tendency to buy high or sell low. We appreciate why investors tend to make poor timing decisions over time. It is financially and psychically painful to be concentrated in the worst segments. Conversely, when stocks or market segments are moving higher, it can induce FOMO (the fear of missing out) when we don’t own them.
While no approach is perfect, we believe investors are well served to do a few things. First, adopt a long-term view. Second, intentionally diversify. Lastly, own securities that help ensure you capture ‘your fair share’ of the gains that accrue from owning what prove to be the best performing stocks in the future. The rest of this letter articulates why each of these are important tenants of success.
As my most recent letter revealed, stocks have handily outpaced the returns for things like inflation over extended periods of time. That’s because successful companies are able to generate sales and earnings growth that exceeds inflation (e.g., ‘real growth’). That said many, if not most stocks, including those with prior attractive track records fail to keep up with the aggregate gains of indexes including the S&P 500. That’s largely because the business results for many companies and industries deteriorate over the long term. Today’s ‘it industries’ mature while new, faster growing companies emerge. This dynamic of our economy is known as Creative Destruction. Another reason is some stocks flourish due to significant increases in valuation. However, if valuation peaks and significantly declines, it is hard for stocks to perform ‘better than average.’ The good news is a relatively small number of key contributors can offset the adverse effect of declines in others, such that the aggregate results are favorable. Please see the hypothetical portfolio below.
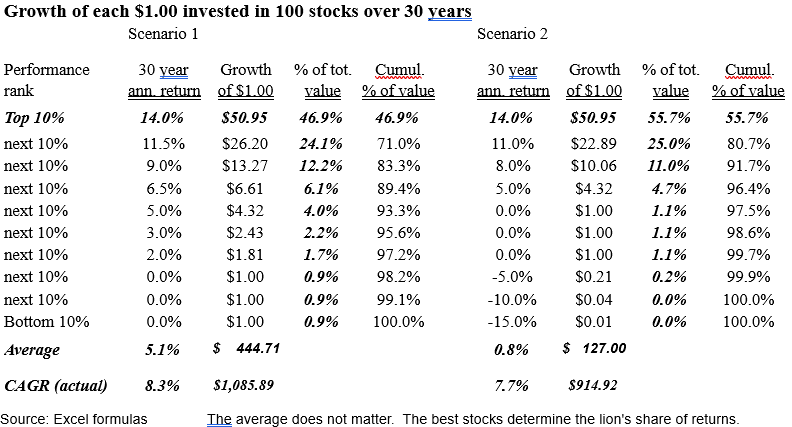
The table above warrants explanation. First, it shows what happens if an investor allocates $1.00 into each of 100 stocks and then holds those positions for 30 years. In Scenario 1, the top 10% (e.g., 10 stocks) have a compound annual return of 14%, the next decile 11.5%, etc. The average for the 10 deciles is 5.1% and if you invest $100 for 30 years at an annual rate of 5.1%, you would have $444.71 in 30 years’ time. However, the average is not what matters. That’s because the top few deciles drive the lion’s share of the total gain. The compound annual growth rate (CAGR) is significantly higher than the simple average of 5.1%. Under Scenario 1, the CAGR is 8.3%, so $100 grows to $1.085.89 in 30 years. This is what actually happens under buy and hold to any diversified portfolio over time. The lion’s share of the gains is due to growth by the relatively small number of positive outliers. Indeed, under Scenario 2, 6 out of 10 deciles don’t grow at all. Three have a lifetime return of 0% and the bottom 3 lose the majority of their value. The ‘average’ for this group is just 0.8% per year, but because of the increase in value of the positive deciles, the aggregate gain is 7.7% annually. What’s the key takeaway? You don’t have to pick the winners if you own index-based market segments. The winners ‘find you’ and drive the vast majority of the gains. That why diversification can be less risky than ‘active management.’
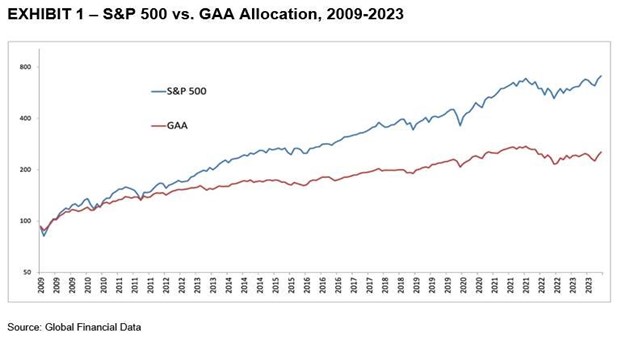
Does diversification win all the time? No, but we believe it provides less volatile returns over time so diversification entails less risk with respect to each investor’s time horizon. Since the GFC (Great Financial Crisis), it has been a decidedly a U.S. large cap stock environment. No horse race here - the S&P 500 has trounced broadly diversified portfolios (e.g., GAA – a Globally weighted asset allocation portfolio).
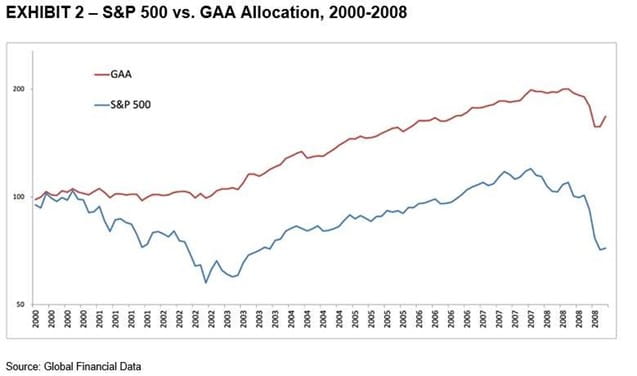
The questions are – 1) is this normal or unusual? 2) has the world changed such that the lessons of history are irrelevant? 3) could I just sell the segments that provide diversification and expect to fare well? Below is a chart that shows these two indices over the 9-year period from yearend 1999 through year end 2008.
The final chart in this series shows the performance of the S&P 500 compared to the globally diversified portfolio over the past 50+ years.
Exhibit 3 – S&P 500 vs. GAA Allocation, 1973 – 2023 (e.g., the past 51 years)
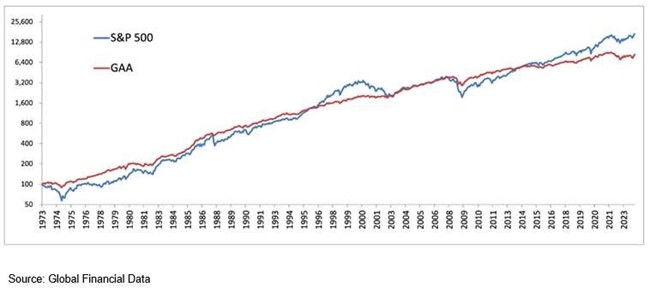
As the chart above shows, until the past 15 years, it really was a horse race. Indeed, until the mid-1990s, the GAA outpaced the return for the S&P 500 going back to yearend 1972. One question is whether the GAA will once again pass the S&P 500 since the end of 1972? Quite possibly. However, I believe the only things that really matter are –
- Will the S&P 500 likely, consistently and in the aggregate surpass the returns for the GAA going forward?
- Are there any risks to not being diversified?
First, the only returns that matter are those that lie ahead. We simply can’t go back in time. However, we can use history as a frame of reference. Long-term data reveals there have historically been extended periods when the S&P 500 performs poorly. Periods of poor performance were preceded by periods of strong performance like the one we have experienced these past 15 years. Consistent outperformance by the S&P 500 seems unlikely.
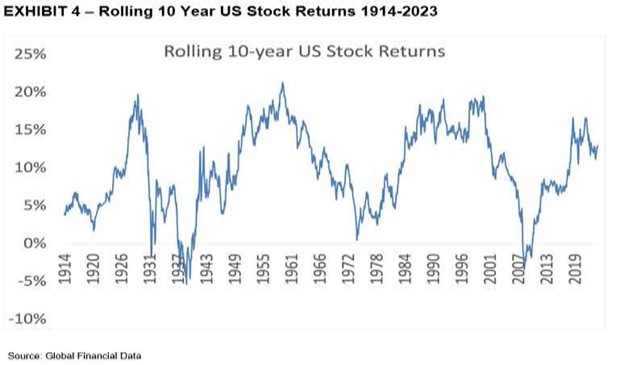
As the chart on the prior page shows, there have been a few periods over the past 110 years when the 10-year rolling return for the S&P 500 has been as high or even higher than what we have experienced since the GFC. Each of those periods was followed by periods when the 10-year rolling return fell sharply (e.g., to roughly 0%). What lies ahead? We don’t know. That said, we are steadfast in our belief that it will likely be beneficial to continue to diversify your and our personal investment capital.
Since the bottom of the GFC 15 years ago, the S&P 500 has compounded at about 15% annually – well above its long-term average. Might we experience extra innings (e.g., 2 or more years) of strong returns? Of course. However, it strikes as unlikely the gains will continue apace over the next decade. Furthermore, it may turn out that we experience leadership from one or more equity segments that have appreciably lagged including U.S. small and mid-caps, large cap value and/or developed or emerging markets international segments. By their very nature, reversals confound the expectations of many, if not most, investors when they do occur.
In summary, the resolve of diversified investors gets tested from time to time. This is particularly true whenever one’s ‘home country’ stock market performs appreciably better than most other market segments for extended periods of time. While we don’t know when leadership will change, we believe the favorable run for the S&P 500 and NASDAQ are likely to run their course at the top of the leader board. When that happens is anyone’s guess, but we do know that valuation metrics for these two indices are at the high end of their historical norms. We also know that other market segments are selling at much lower valuations both on an absolute and relative basis. If those metrics expand, these lagging segments could once again lead in the future. The majority is in the U.S. market, but we know that historically other market segments have historically provided ballast when our domestic stocks provide disappointing results. That is why we are firmly committed to staying the course vis-a-vis our diversified equity allocation. Our job is to manage risk over time. We are confident that this focus can foster good outcomes. We believe the key to doing so is to own meaningful allocations to various market segments, including bonds and stock segments in the U.S. and abroad that will likely wax and wane over time.
Warmest regards,
Richard Jones, CFA
Partner, Harmony wealth Partners
Securities offered through Raymond James Financial Services, Inc., Member FINRA/SIPC. Investment advisory services offered through Raymond James Financial Services Advisors, Inc. Harmony Wealth Partners is not a registered broker/dealer and is independent of Raymond James Financial Services.
Any opinions are those of W. Richard Jones and not necessarily those of Raymond James. The information contained in this report does not purport to be a complete description of the securities, markets, or developments referred to in this material, is not a complete summary or statement of all available data necessary for making an investment decision and does not constitute a recommendation. The information has been obtained from sources considered to be reliable, but we do not guarantee that the foregoing material is accurate or complete. There is no guarantee that these statements, opinions or forecasts provided herein will prove to be correct. Past performance may not be indicative of future results. Future investment performance cannot be guaranteed, investment yields will fluctuate with market conditions. Investing involves risk and you may incur a profit or loss regardless of strategy selected, including diversification and asset allocation. Prior to making an investment decision, please consult with your financial advisor about your individual situation. The S&P 500 is an unmanaged index of 500 widely held stocks that is generally considered representative of the U.S. stock market. The NASDAQ composite is an unmanaged index of securities traded on the NASDAQ system. Keep in mind that individuals cannot invest directly in any index, and index performance does not include transaction costs or other fees, which will affect actual investment performance. Individual investor's results will vary. The hypothetical examples used are for illustration purposes only and do not represent the performance of any specific investment or product.
