Trends are firmly in place - That could change
Supported by favorable fundamentals, U.S. large caps continue to lead most, if not all, other market segments. While this trend could persist for some time, we believe a change of leadership is highly likely. Markets tend to ebb and flow and pronounced changes in leadership often occur when least expected. The table below shows the total annual return for the S&P 500 (U.S. large cap) and Russell 2000 (U.S. small cap) indexes.
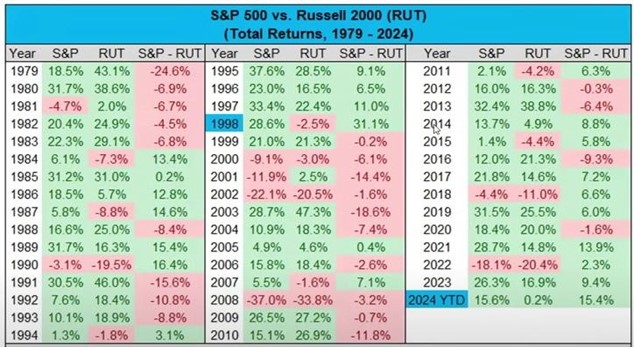
Source: Creative Planning
With the exceptions of 2013 and 2016, the S&P 500 has dominated the returns for the Russell 2000 since 2010. Indeed each $1.00 invested in the two indexes would have grown to $4.97 and $3.09, respectively over this 13 ½ time period. These translate into annualized returns of 12.6% and 8.7%, respectively. If you include 2009 and 2010, each $1.00 invested would have grown to $7.23 (13.6% CAGR) and $4.99 (10.9% CAGR), respectively. The past 15 ½ years have been a terrific time for U.S. large caps compared to small caps.
The table also shows that the S&P 500 has had extended periods when it has significantly underperformed the Russell 2000 and/or when it has lost considerable value over a multi-year time period. For example, from year end 1999 thru year end 2008, each $1.00 in the S&P fell 28% to $.72 (CAGR -3.6%) compared to a modest gain of $1.065 (CAGR 0.7%) for the Russell 2000. Generally speaking, periods of strong gains are marked by periods of low and rising increases in both EPS (earnings per share) and valuation (e.g. the PE ratio).i The table at the top of page 2 shows the S&P 500’s dominance over international markets over the past 14+ years.
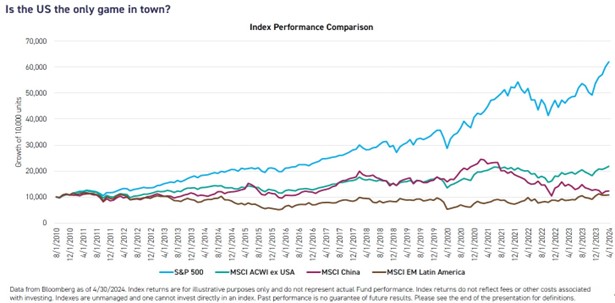
There are a number of important fundamental and valuation factors that have translated into the winning streak for the S&P 500. These include increased profitability of U.S. companies, an increase in valuation from low PE ratios at the start of this phase, and strength is U.S. $ versus other currencies. International stocks have fared poorly for opposite reasons including declines in valuation and in the value of their currencies and lower EPS growth. Franklin Templeton among other global firms believe these conditions could change. Please see some slides from a recent publication from that well-known global firm.

After years of relatively lackluster EPS growth for international markets, Franklin Templeton and other global firms, believe earnings growth may accelerate this year and over the next several years. Starting from relatively low absolute (and relative to the U.S.) valuation metrics, international markets may provide favorable returns over a multi-year time frame.

Starting from relatively low bases, decent/healthy aggregate earnings growth in international equity indexes could pave the way for increases in the PE ratio. That combination could enable international equity markets to generate healthy gains for investors.
Lastly it is important to note that much of the gains in the S&P 500 have been driven by gains by a relatively small number of mega-cap stocks. So far this year, the S&P 500 cap weighted index has had a price gain of 15.7% thru the close on July 2nd compared to just 4.0% for the S&P 500 equal weight index (price only for both). The largest 10 stocks in the S&P 500 account for the lion’s share of gains in the index. In a distinct departure from history, the top 10 have increased in share of market cap, when historically they have tended to experience a decline in relative market value.

This is reminiscent of the late 1990s bull market. Mega cap and tech stocks led returns by a wide margin. Investors added aggressively to the unambiguous leaders near the end of that strong bull phase. Subsequently the leaders underperformed other market segments by a significant margin. As you know, we are committed to owning broad equity market exposure across all market environments. Doing so can help ensure we are not overly concentrated in segments that subsequently lose significant value for an extended period of time.
We don’t know what the near term holds – that’s why we diversify both our equity and fixed income holdings. We believe time and incorporation of valuation metrics can help foster favorable outcomes. It is often darkest before dawn, but we think it is likely that laggards will once again provide leadership and current leaders may yield surprisingly poor results.
Richard Jones, CFA
Partner, Harmony Wealth Partners
i Look at the 9-year period 1991 thru 1999. EPS gains were magnified by a sharp increase in the PE multiple that enabled each $1 invested in the S&P 500 to grow to $5.50. While EPS growth was healthy, much of the increase was attributable to a significant rise in the PE ratio. Investors were decidedly bullish on U.S. large cap (especially ‘growth’ stocks) in early 2000 and most expected significant gains to continue. The S&P 500 subsequently fell over the next 3 years, primarily because the PE ratio contracted sharply. When valuations are elevated compared to historical norms, markets can and often confound expectations on the downside. The opposite is true for segments that have provided extended periods of lackluster results. In sum, powerful bull phases often begin when uncertainty is high and investor expectations and valuation metrics are low. Investors lose confidence after major bear market declines. PE declines translate into sub-par results, but eventually low multiples and low expectations pave the way for price change that surprises on the upside. While identifying inflection points is inherently challenging (undervalued markets can deteriorate further and vice versa), we believe today’s unloved market segments including U.S. value, mid and small caps and international markets are attractively priced and could provide favorable results over a multi-year period. Diversification can and often does provide smoother returns (less dramatic fluctuation in portfolio value) over extended periods of time. We will continue to hold strategic allocations in segments that have and likely will perform materially differently over time.
Any opinions are those of W. Richard Jones and not necessarily those of Raymond James. This material is being provided for information purposes only and is not a complete description, nor is it a recommendation. The information has been obtained from sources considered to be reliable, but we do not guarantee that the foregoing material is accurate or complete. Any information is not a complete summary or statement of all available data necessary for making an investment decision and does not constitute a recommendation. Expressions of opinion are as of this date and are subject to change without notice. This information is not intended as a solicitation or an offer to buy or sell any security referred to herein. Investments mentioned may not be suitable for all investors. There is no guarantee that these statements, opinions or forecasts provided herein will prove to be correct. Past performance may not be indicative of future results. Investing involves risk and you may incur a profit or loss regardless of strategy selected, including diversification and asset allocation. Every investor's situation is unique and you should consider your investment goals, risk tolerance and time horizon before making any investment. Prior to making an investment decision, please consult with your financial advisor about your individual situation. The S&P 500 is an unmanaged index of 500 widely held stocks that is generally considered representative of the U.S. stock market. The NASDAQ composite is an unmanaged index of securities traded on the NASDAQ system. International investing involves special risks, including currency fluctuations, differing financial accounting standards, and possible political and economic volatility. Links are being provided for information purposes only. Raymond James is not affiliated with and does not endorse, authorize or sponsor any of the listed websites or their respective sponsors. Raymond James is not responsible for the content of any website or the collection or use of information regarding any website's users and/or members.
