Risk Management
“For any business, when you think about risk, think about things that can go terribly wrong. Can you survive them?”
- Jamie Dimon
Risk management (not the same as risk avoidance) lies at the heart of our approach to managing your financial assets. While we have a good understanding of prior market cycles, we don’t know what the future holds. That’s because the economy and markets are dynamic, and each period in history has its own unique conditions.
While thriving in the best of times is of course desirable, surviving (emotionally and financially) in the worst of times is essential. Our approach is designed to help ensure we can persevere during lean times as opposed to getting the highest return in the best of times. In the same interview on Bloomberg, Jamie also said, “You can’t be prepared after the fact. You have to be prepared before the fact. When I talk about risk management, it’s always about the range of outcomes and can we handle them?”
When the economy and markets are unquestionably ‘moving in the right direction’, it is natural to want to capitalize on the trend and ride the wave via concentrating in the best market sectors. However, this approach can lead to costly mistakes if, and when, markets decidedly move in the other direction. During sharp reversals like we saw in 2000 – ’02, 2007 – ’09 and the sharp Covid-19 sell-off, investors can find themselves ‘over their skis’ and look to move decidedly the other way. The problem is timing markets well is easy in theory and inherently difficult to do.
We know that the combination of healthy sales and earnings growth is often magnified by an increase in valuation. We seek opportunities to capitalize on these favorable developments. However, our approach is not based upon maximizing returns in the best of times. Rather we are focused upon minimizing the risk of unacceptable outcomes so that we can hopefully reduce losses in the worst of times. We do this by allocating meaningful amounts of your capital in market segments that 1) we think will likely produce favorable long-term results and 2) that will likely perform differently along the way. That means, our multi-segment equity allocation is expected to underperform whenever U.S. large caps (e.g. the S&P 500) is at or near the top of the leaderboard. Nevertheless, during these periods our conviction to stay the course remains high. That’s because the longer and higher an uptrend goes, the greater the tendency to reverse course in a drastic and/or sustained way. The opposite is true. Segments that significantly underperform in one market environment can and often do surprise on the upside. Our commitment to stay the course ensures our approach will perform at least relatively well when US markets fall precipitously over extended periods.
In summary
Ensuring favorable long-term outcomes is not easy. Setbacks along the way are inevitable and investors must maintain resolve through thick and thin economic and market environments. That plus a commitment to invest capital for the long-term as opposed to consuming it today can help ensure your wealth grows net-of-inflation and the inevitable market setbacks that we believe lie ahead is essential.
As you will see, I have included a recent chart with some commentary in an endnote.i I want to conclude this letter with a couple of quotes from the legendary investor and writer Peter Bernstein. He said, “The only time you’re really diversified is when you have assets that you don’t want to own.” Our courage and resolve get tested along the way. He also said, “Diversification is an explicit recognition of ignorance.” The inverse might be that high concentration might indicate a high degree of confidence that proves unwarranted. We don’t know what lies ahead – that’s why we diversify.
We appreciate your continuing confidence in our team and our firm.
W. Richard Jones, CFA
Partner, Harmony Wealth Partners
i
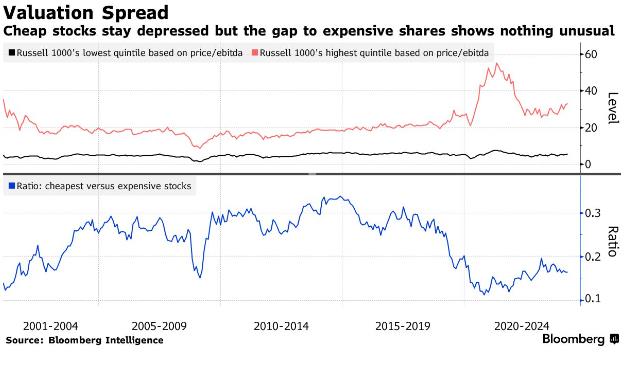
My comments – In the top half you can see that the lowest quintile of stocks in the Russell 1000 index have had relatively steady valuation metrics these past 24 years. In more recent years, valuations metrics for the highest quintile of stocks has increased significantly relative to the lowest quintile. The same was true in the ‘growth is king’ environment in the late 1990s. The lowest quintile performed quite well in the dotcom selloff in 2000 – ’02 and for many years thereafter. What lies ahead is unknown, but history suggests investors should refrain from concentrating in the most ‘in favor’ segments when their valuation metrics are extended.
Any opinions are those of W. Richard Jones and not necessarily those of Raymond James. The information contained in this report does not purport to be a complete description of the securities, markets, or developments referred to in this material, is not a complete summary or statement of all available data necessary for making an investment decision and does not constitute a recommendation. The information has been obtained from sources considered to be reliable, but we do not guarantee that the foregoing material is accurate or complete. There is no guarantee that these statements, opinions or forecasts provided herein will prove to be correct. Past performance may not be indicative of future results. Future investment performance cannot be guaranteed, investment yields will fluctuate with market conditions. Investing involves risk and you may incur a profit or loss regardless of strategy selected, including diversification and asset allocation. Prior to making an investment decision, please consult with your financial advisor about your individual situation. The S&P 500 is an unmanaged index of 500 widely held stocks that is generally considered representative of the U.S. stock market. The Russell 1000 measures the performance of the 1,000 largest companies in the Russell 3000 Index, which represents approximately 90% of the investible U.S. equity market. The Russell 1000 is highly correlated with the S&P 500 and is reconstituted annually on May 31. Keep in mind that individuals cannot invest directly in any index, and index performance does not include transaction costs or other fees, which will affect actual investment performance. Individual investor's results will vary. The chart is for illustration purposes only. Raymond James is not affiliated with Jamie Dimon.
Securities offered through Raymond James Financial Services, Inc., Member FINRA/SIPC. Investment advisory services offered through Raymond James Financial Services Advisors, Inc. Harmony Wealth Partners is not a registered broker/dealer and is independent of Raymond James Financial Services.
