A Picture Worth A Thousand Words
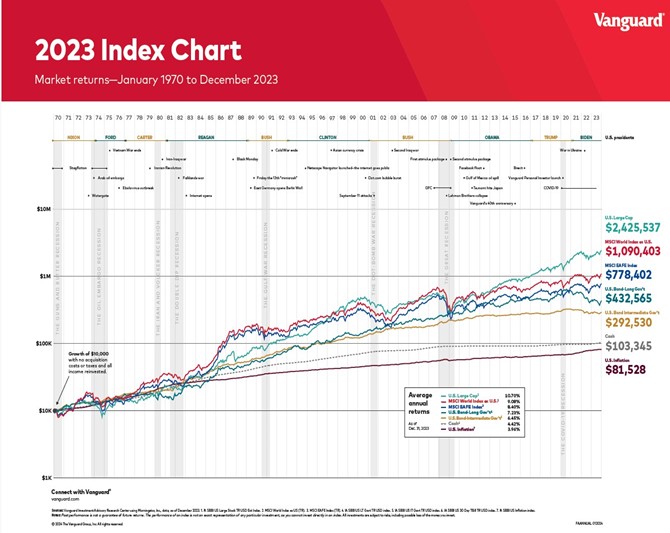
While the chart above is worthy of detailed description, I have done my best to reduce commentary. Let’s start with inflation. You need $81,528 today to have the same purchasing power as $10,000 at the start of 1970. As the table embedded in the chart shows, inflation has averaged 3.98% over the past 54 years. In 1970, a Cadillac Fleetwood had an MSRP of $7,284 which would equate to $59,384 today. Lots of vehicles sell for more than that inflation adjusted price today, but they are more reliable with enhanced safety and other features that simply weren’t available in 1970. Depending on location, if a house was worth $100,000 in 1970, it might easily be worth $800,000 or more today. Higher education and healthcare costs have also increased more than overall inflation. The point being that it is essential for investors to achieve returns that exceed inflation to maintain their financial well-being. Investment in cash/money market funds barely exceeded the rate of inflation. Investors can and should invest in ‘risk-assets’ in order to earn returns that exceed inflation.
Seemingly small differences in return add up to substantial differences in return over decades. U.S. large caps earned a compound annual return of 10.7% so each $10,000 invested at that rate would have grown to $2.425 million before taxes. International stocks excluding the U.S. also fared well relative to inflation.i An investment of $10,000 in this segment would have grown roughly 100-fold to $1.090 million (or 9.1% annually). So far so good. This should be easy right? The problem of course is stock returns fluctuate a great deal along the way, so long-term returns of roughly 10% on average, look anything but smooth along the way.ii
Since 1970, the S&P 500 dropped by roughly 50% 3 times. From the then all-time highs, there were extended time periods when returns from prior peaks were decidedly negative.iii Here are some examples –
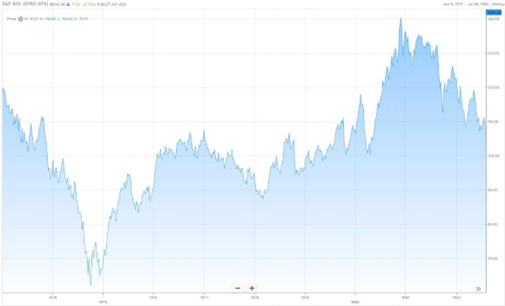
The chart on the left shows the price for the S&P 500 From January 5, 1973 thru July 30, 1982. During this 9 ½ year period, the price level was still 9% below the high in a period when inflation was really high. It was a lost decade and then some. Investors who sold near the late 1974 lows suffered huge losses.
Source: FactSet
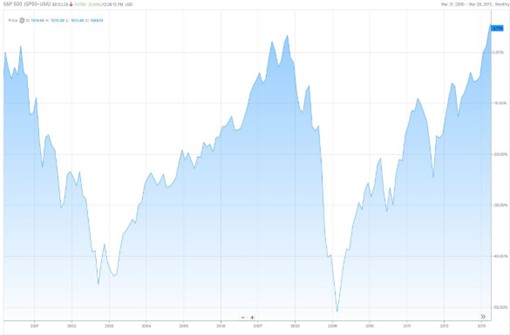
The chart on the left shows the S&P 500 price over a 13-year period – March 31, 2000 through March 28, 2013. The aggregate price gain over this period was a paltry 5% and during this period the S&P 500 lost roughly 50% of its value twice. Investors who stayed the course have been handsomely rewarded, let alone those who bought during periods of turmoil.
Source: FactSet
“You can do it.” – Rob Schneider
For those of you who are just getting started investing, amassing wealth through investing can seem daunting. I get it – I was once young too. That said, it is clear that our purchasing power erodes over time. Inflation is an unseen thief. Nevertheless, it is worth pointing out that as great as the growth in value of $10,000 invested in
U.S and international stocks has been these these past 54 years, if the starting amount was $25,000 instead of
$10,000, an investor who bought and held, would have 2.5x more. On the other hand, if $10,000 were invested each year starting in 1970, then the sum today would be many multiples greater than a single investment of
$10,000. Investment portfolios are a function of how much you save for the future versus consume today. The great thing is that without foreknowledge you know you will acquire more shares in something like the broad market when prices prove to be low rather than high. The discipline to invest overtime pays very well indeed.
Summing Things Up
It is clear that over extended periods of time, the rewards for investing in the broad stock markets (both U.S. and international) can be significant. While inflation has risen 8-fold since 1970, the total return (before taxes) for an investment in U.S. large cap stocks has increased over 200-fold. That said, successful long-term investing is challenging. Many investors do not begin to realize long-term results that are as good as, let alone better than, the compounding that has happened in the asset classes shown in the chart at the top of the first page. When the news on the economy is highly favorable, markets tend to reflect those conditions and vice versa. Indeed, price changes tend to move much further on the upside and downside than aggregate changes in the economy and corporate sales and earnings themselves. However, at extremes in economic and market cycles, those changes in valuation seem reasonable to many ‘in the moment’ investors.
In hindsight, we all understand that the NASDAQ got way ahead of itself in early 2000 or that stocks were unduly cheap in late 2008/early 2009. However, we are well-served to remember that the headlines and our emotions were often telling us the opposite. The good news is patience and perseverance are allies of long-term investors. So is diversification. Market data clearly shows that market segments tend to perform differently over time. Sometimes U.S. mid and small caps performing appreciably better than U.S. large caps and vice versa. The same is true for international equities. They have historically outpaced the return for the S&P 500 for extended periods of time and by wide margins. By owning all or most major market segments and holding ‘rainy day reserves,’ we can better maintain a long-term allocation to assets that tend to perform well over decades (but with noteworthy declines along the way). This time-tested approach can also help us maintain our resolve during the inevitable times of contraction along the way. Indeed, ‘rainy day reserves’ can help us stay the course when headlines and account statements scream – “get out.” Our charge is clear. We need to continue to proactively manage risk along the way and communicate accordingly.
Warmest regards,
W. Richard Jones, CFA
i As the chart on page 1 shows, U.S. large cap caught up to international around 2012. Since then, U.S. stocks have had a nice increase in aggregate earnings and a healthy increase in the PE multiple. Prior to then, international handily outpaced the return for U.S large caps. International could quite possibly surpass the returns for the U.S. since year-end 1969. However, all that really matters is how the two perform from here as we can only capture future returns. That’s a key reason why we diversify.
ii
The chart above is interesting. The S&P seldom provides annual returns that are close to the long-term average of 10% (e.g., 8% to 12%). About ¼ of the time the returns are negative and declines and advances can come in bunches.
iii The S&P 500’s 10.7% annual return since year-end 1969 includes two extended periods (e.g., more than 14 years each) of negative or flattish returns. Bull market phases can and sometimes do last even longer. That makes it hard for many investors, especially those that have never directly experienced a ‘full market’ cycle, to maintain perspective when markets decidedly change direction. During protracted periods of lackluster returns, significant distributions of principal and/or high rates of inflation can translate into adverse wealth changing experiences for investors who own ‘concentrated portfolios.’ By concentrated I am including 100% in something as broad as the S&P 500. Sadly, some investors capitulate and sell after significant declines due to the real fear of further devastation. Because we cannot predict, we must deploy time-tested principles of diversification, and maintain steadfast resolve when it’s needed most.
Any opinions are those of Richard Jones and not necessarily those of Raymond James. This material is being provided for information purposes only and is not a complete description, nor is it a recommendation. Past performance is not a guarantee of future results.
Investing involves risk and investors may incur a profit or a loss. The information has been obtained from sources considered to be reliable, but we do not guarantee that the foregoing material is accurate or complete. The indexes mentioned are unmanaged and cannot be invested into directly.
