SPIVA 2023 – THE SONG REMAINS THE SAME – AGAIN!
Immediately below is the latest chart for manager outperformance/underperformance through year-end 2023. These results are once again sobering – especially over longer time frames of 10+ years.

Source: SPIVA U.S. Scorecard Year-End 2023
There are a number of reasons why most active managers fail to outperform the index that corresponds to their strategy. First, their expense ratios detract from performance. Second, most stocks generally don’t do as well as the index itself. That makes it hard to allocate to those that do and avoid those that do not. Also, the number of active managers that outperform the index would be lower in taxable accounts on a net-of-tax basis. Last but not least, it is important to note, most investors tend to move in and out of active managers at inopportune times so their actual returns are often not as good as those vehicles themselves. That is why we favor index-based solutions. The expense of owning them tends to be low and tax-efficiency high. If you like getting into the details, I have embedded a link to this year’s report in an endnote.i
Changing gears – Why we see leadership changes among market segments
Going back to the end of the GFC (global financial crisis), U.S. large cap growth has generally been a sweet spot in the equity markets. The noteworthy exception was in 2022, when the Federal Reserve raised the Fed funds rate dramatically causing high multiple (e.g., PE ratio) stocks to sell off sharply. Favorable economic growth, combined with profit margin expansion and an increase in valuation metrics has translated into price gains especially for many of today’s tech darlings.ii The same is not true for other equity market segments. Generally, valuation metrics in international markets have been modest and often lower over recent years.
Throughout my career, I have been acutely aware of the impact that rising and falling PE ratios have upon short and intermediate investment gains and losses. Leadership changes often catch many investors offsides. Therefore, we believe investors are well served to consider valuation metrics (e.g., things like the PE ratio) when making allocation decisions. That’s because if you find securities that are selling at relatively low valuation metrics, you increase the probability of realizing favorable results over the intermediate or longer-term than if you just buy whatever securities have recently performed quite well (due in large part to recent increases in their valuation metrics).
Below are two hypothetical examples. In the top of the table, the PE ratio doubles and investors enjoy a tailwind. In the bottom portion, the opposite occurs. The PE ratio declines by 50% (in this example from 24x to 12x). If the change in PE occurs in a short period (e.g., 5 years) the impact is powerful compared to when the change in PE is over a longer time period. I have placed additional comments on this subject in an endnote.iii

In both the top and bottom tables, the EPS growth rates are the same. The difference is the change in the PE ratio. Obviously, it is beneficial to seek out securities with low valuations that can expand versus paying too much and experiencing a valuation contraction. While it is hard to forecast when valuation metrics will expand and contract, investors are well-served to consider valuation when deploying capital.
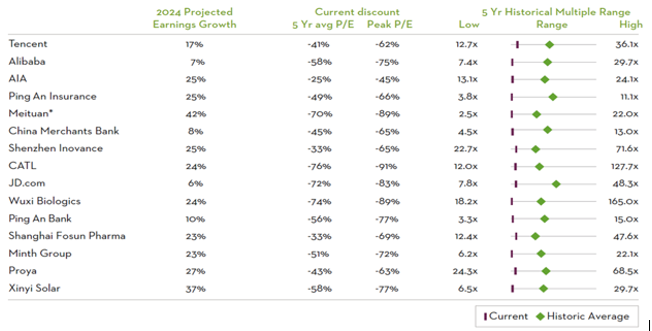
As I have shared before, we continue to find investments in international markets to be prudent. That’s because valuation metrics in major U.S. indexes are elevated relative to historical norms. That is not the case, in many international markets. In China, for example, the opposite is true. On the next page, there are two tables that highlight the recent price change, EPS growth and valuation metrics of large cap- Chinese stocks.
The tables below show some of the top Chinese stocks by market cap. The top table includes the 2023 EPS growth and price performance, respectively. The bottom table shows 2024 estimated EPS growth as well as the current and 5-year valuation metrics.

Throughout history, leadership changes among stock market segments (e.g., ‘growth’ vs. ‘value’ large vs. mid and small caps, U.S. and various international markets) have been commonplace. Many investors allocate to segments where returns have been pleasing and the news has been favorable. While that is understandable, it is important to recognize that stocks and major market segments often are priced significantly above and below historical valuation metric norms.
In summary, good news and then some is often ‘priced in’ at market tops and despair is reflected in valuations at what prove to be market low inflection points. Sadly, many investors and active managers find themselves overly concentrated in market segments that ‘surprise on the downside’ (e.g., decline dramatically). Conversely, they often have little if any ownership of lagging segments that then surprise on the upside. We don’t know when and where major inflection points lie, but we do know that diversification has been a long-term ally of investors. Major U.S. indexes are closer to the upper range of their historical valuation metrics. With respect to U.S. large caps, we last saw valuation metrics like this in the late 1990s.iv Conversely, current valuation metrics for major international markets are on the lower end of the valuation spectrum. While both reflect sentiment and conditions that are prevalent today, we would not be surprised to see meaningful changes in leadership in the years ahead.
Warren Buffett said, “The stock market is a device for transferring money from the impatient to the patient.” Mindful of valuation and myriad other considerations, we intend to continue to exercise patience with allocations in segments that we believe will once again add considerable ballast to our portfolios when large cap U.S. stocks are performing poorly.
As always, we welcome your comments and questions.
Warmest regards,
W. Richard Jones, CFA
i https://www.spglobal.com/spdji/en/spiva/article/spiva-us/
ii
As was the case in the late 1990s, large cap tech stocks have fueled most of the gains in the S&P 500 over the past 12 months. As the chart below shows, semiconductor stocks have handily outpaced the return for the rest of the S&P 500. The question is whether they will sustain these gains or, as was the case in the early 2000s, falter and cause significant declines in major market averages like the NASDAQ and the S&P 500.

The chart above shows the huge relative gains in the late ‘90s and subsequent declines in 2000-15, for semi-conductor stocks respectively. The relative outperformance in recent years is similar to the late 1990s. The future for these stocks??
iii Over the course of my career, I have enjoyed a front row seat to periods of significantly expanding valuation metrics. A 3x increase in valuation from 10x to 30x (or 15x to 45x) translates into a 6-fold increase in price when underlying EPS doubles. Because valuation metrics tend to wax and wane, I find it sensible to be cautious with respect to allocating into segments that have experienced significant increases in valuation metrics. Conversely, I appreciate the potential benefit to leaning into segments that have fallen or at least languished due to large valuation declines. That’s because if a segment goes from a PE of 36x to 12x while underlying EPS, doubles, the price will decline by 1/3 (e.g., from $36 to $24). Importantly at some point, that same security may be poised for significant gains if the PE multiple subsequently expands.
iv

Source: FactSet. The chart above shows the price, PE and Prices to Sales ratio for the S&P 500 over the past 20 years. While hard to see, at its March 2009 lows, the S&P 500 traded at 9x EPS and just .7x times sales. The PE ratio rose to 30x in 2021 and is at 25.4x today. The prices to sales ratio rose to 3.14x in 2021 and is 2.79x today. These ratios are up roughly 3x from the March 2009 lows.
One cannot invest directly in an index. Any opinions are those of Richard Jones and not necessarily those of Raymond James. This material is being provided for information purposes only and is not a complete description, nor is it a recommendation. Past performance is not a guarantee of future results. Investing involves risk and investors may incur a profit or a loss. The information has been obtained from sources considered to be reliable, but we do not guarantee that the foregoing material is accurate or complete. S&P 500 Widely regarded as the best single gauge of the U.S. equities market, this market capitalization-weighted index includes a representative sample of 500 leading companies in the foremost industries of the U.S. economy and provides over 80% coverage of U.S. equities. S&P Midcap 400 This index consists of 400 mid-sized companies and covers approximately 7% of the U.S. equities market. S&P SmallCap 600 This index consists of 600 small-cap companies and covers approximately 3% of the U.S. equities market. S&P Composite 1500 This is a broad, market-capitalization-weighted index of 1500 companies formed by combining the S&P 500, S&P Midcap 400 and S&P SmallCap 600. The index represents approximately 90% of U.S. equities. S&P 500 Growth and Value Indices These indices form an exhaustive, multi-factor style series covering the entire market capitalization of the S&P 500. Constituents, weighted according to market capitalization, are classified as growth, value or a mix of growth and value. SPIVA 39 SPIVA U.S. Scorecard Mid-Year 2023. S&P Midcap 400 Growth and Value Indices These indices form an exhaustive, multi-factor style series covering the entire market capitalization of the S&P Midcap 400. S&P SmallCap 600 Growth and Value Indices These indices form an exhaustive, multi-factor style series covering the entire market capitalization of the S&P SmallCap 600. S&P Composite 1500 Growth and Value Indices These indices form an exhaustive, multi-factor style series covering the entire market capitalization of the S&P Composite 1500. S&P United States REIT This index measures the investable universe of publicly traded real estate investment trusts.
