There's (often) Something About March
Many Wall Street firms provide their estimates for year-end price levels for indexes like the S&P 500. Strategists at these firms start with an outlook for the economy, then derive an estimate of aggregate corporate earnings per share and then apply the PE multiple that they believe is reasonable in light of things like inflation and interest rates, etc. From those inputs they derive a price estimate. While these are arguably reasonable things to do, we believe they create risks for investors. First, if these ‘market seers’ could accurately predict the magnitude of price level increases or decreases, then it would make sense to change our asset allocation accordingly. However, during years when markets move strongly up or down, let alone abruptly change direction, those projections are often decidedly off the mark. When shorter-term price estimates miss the mark by wide margins, some investors can feel whipsawed, lose confidence and make significant changes to their allocations at inopportune times. In response to gains or reversals, firms often change their year-end forecasts along the way. Often those price level changes have already largely occurred (so no change in allocation is warranted). ii Investors are wise to acknowledge that short and intermediate price changes are normal, largely unpredictable and relatively insignificant over the course of their investment journeys. Furthermore, we believe asset allocation decisions should be based upon one’s time horizon, objectives and preferences and not on the ever-changing projections about things that are inherently difficult to consistently predict.
The chart below is the price level of the S&P 500 index going back to year-end 1999.
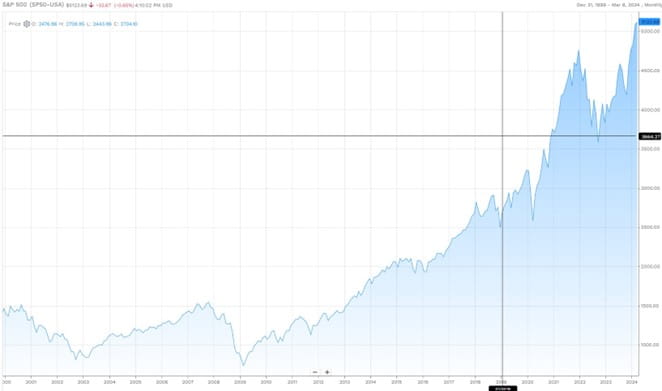
Source: FactSet. The table on the next page provides highlights.
The table below provides dates (mainly all-time highs and bear market lows), corresponding price levels and point-to-point return figures (price change only) for the S&P 500. The data starts with March 31, 1995.
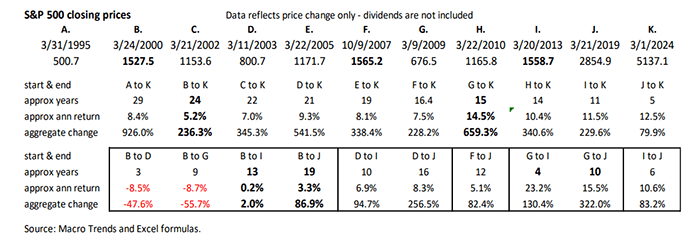
The bullet points below should aid your review of the table above –
- Fund flow data reveals that many investors were aggressively buying stocks in the late 1990s and selling aggressively near and after the 2002 and 2009 bear market lows.
- The return figures reflect price change only. Dividend yields would have added +/- 2%.
- Markets embody our collective emotions and can travel far above and below underlying fundamentals.
- Valuation matters. Purchases made when things like the PE are low and dividend yields are high fare better than those when the market has been ‘on a tear’ (due to PE expansion).
- The change in the S&P 500 price level fluctuates a great deal more than changes in things like annual GDP, corporate sales, cash flow, dividends and earnings. Therefore, investors are better off focusing not on ever changing headlines, price levels and near-term forecasts, but on the long-term growth in the index’s earnings, cash-flow and dividends, and valuation metrics, etc.
While not shown, other equity markets behave very differently than the S&P 500. Investors can reduce the magnitude of fluctuations along the way, by holding diversified equity allocations. Presently, many segments outside of U.S. large cap core (e.g. the S&P 500) and large cap ‘growth (e.g. the NASDAQ) are selling at significant discounts to their long-term valuation metrics and relative to the S&P 500’s current valuation.
Predicting is hard, Preparing is Essential
Throughout history, the economy and especially markets exhibit cycles of expansion and retreat. Investors who have the wherewithal and fortitude to buy when markets are in decline tend to realize significant long-term rewards (akin to the indexes themselves). Those who tend to buy well into bull runs and/or sell after significant declines tend to fare poorly. We have no idea whether we will avoid a recession this year or next. Of course, we hope we do, but we are pretty certain that recessions lie ahead. We believe it is likely that when they do occur that things like the S&P 500 may perform poorly. While we recognize that economic and market declines can be painful, we believe they pave the way for recovery. If folks stop buying things like cars for several years, that likely means that there will likely be a significant economic upcycle (especially the longer the adverse economic trend occurs). The same is true in reverse. The stock market performed really well in the 1980s and 1990s (especially in the last 5 years). The problem of course is that prices got way ahead of fundamentals. It took 13 years to make new highs and not retreat below the March 2000 high. In the past 15 years, its price gain averaged 14.5% annually or 659.3% cumulatively (3/09/09 – 3/01/24).
In summary, we wish it were possible to accurately and reliably predict things like market price levels a year ahead. However, while the long-term return for things like the S&P 500 (including dividends) is about 10% per year, we seldom get years with returns between 8% and 12%. That’s because economic, geopolitical and other market moving events occur regularly and often but they are hard to predict. Instead of trying to predict near term price levels and change our allocations accordingly, we believe it is prudent to adopt and maintain diversified equity allocations and to hold ‘rainy day reserves.’ We believe it is likely that the U.S. and global economy are likely to grow in the future. We believe that ownership of major market segments makes sense, because economic growth leads to higher aggregate sales, earnings and cash flow. Those are the drivers of longterm increases in equity markets.
Warmest regards,
W. Richard Jones, CFA
Partner, Harmony Wealth Partners
i Of course, many of us enjoy the annual NCAA Women’s and Men’s basketball tournament (e.g., “March Madness”). Julius Caesar was assassinated on The Ides of March (e.g. March 15th 44 BC). The Ides of March was a day in ancient Rome when debts were due (our date is April 15th). When putting together the table on page 2, I was struck by how often the S&P 500 index has made all-time highs and occasionally bear market lows in March. October is another standout month.
Source: Bloomberg
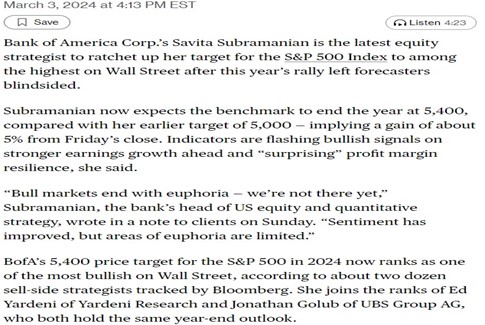
Comment - I believe the never-ending focus on the near term causes many investors to add to or reduce their equity ownership when they would be better financially and psychologically to adopt and then adhere to an allocation strategy that lines up with their needs, objectives and preferences. Lastly, this strategist raised her year end price level estimate 8% from 5000 to 5400. The S&P 500 was already up roughly that same amount on a year-to-date basis, when she raised her year-end target. Therefore, no change in allocation seems warranted IMO. Staying the course in diversified portfolios is prudent.
Any opinions are those of the author and not necessarily those of Raymond James. Expressions of opinion are as of this date and are subject to change without notice. The information being provided does not purport to be a complete description of the securities, markets, or developments referred to in this material, nor is it a recommendation. The S&P 500 is an unmanaged index of 500 widely held stocks that is generally considered representative of the U.S. stock market. Investing involves risk and investors may incur a profit or a loss. Prior to making an investment decision, please consult with your financial advisor about your individual situation.
Securities offered through Raymond James Financial Services, Inc., Member FINRA/SIPC. Investment advisory services offered through Raymond James Financial Services Advisors, Inc. Harmony Wealth Partners is not a registered broker/dealer and is independent of Raymond James Financial Services.
