
The Federal Reserve: Between a rock and a hard (market) place
Chief Economist Eugenio J. Alemán discusses current economic conditions.
The Federal Reserve (Fed), and markets, overreacted to the slightly higher inflation seen during the first quarter of the year. After that scare, the Fed went from expecting three cuts in the federal funds rate in 2024 to just one cut during its June dot plot release. Meanwhile, the markets went from expecting six to seven rate cuts in 2024 back in December of 2023 to barely one cut a little more than two months ago. Overreaction is how the market reacts to new information and, in the end, is the nature of the beast.
But the Fed should know better. We understand the increase in the institution’s risk aversion generated by higher inflation and potentially higher, ‘unanchored’ inflation expectations. This is what happened during the 1970s and 1980s, a period that was called ‘stagflation,’ which combines very high inflation with very low economic growth. In our writings during the last two plus years, we have been fighting the idea that the current period bears any resemblance to the stagflationary period of the 70s and 80s; however, we understand Fed officials’ fears about being careful not to agitate the inflation expectations waters.
At that time, inconsistent monetary policy as well as severe external shocks (a 184% increase in the price of petroleum in 1974 followed by a 149% increase in 1980) came together to create a perfect storm. Today, we still have an independent Fed and consistent monetary policy while we have been coming back from a very severe external shock, the COVID-19 pandemic, and a relatively smaller shock, the Russia-Ukraine war. But the effects of the pandemic and the war have been fading and thus the consistent monetary policy has taken over and is bringing inflation down to the institution’s target.
In the U.S., the inflation target is 2.0% for the Personal Consumption Expenditure Price Index over the long run.1 Back in the 70s and 80s the Fed did not have an inflation target, and monetary policy was conducted in a more, let’s say, discretionary way than today. However, today, the Fed has to stick to its target and do whatever it needs to do to bring inflation down to that target. If it needs to keep interest rates high or higher for longer, it will do so.
Today, markets are overshooting again, pricing in almost 250 basis points in cuts between now and December 2025. We believe this is way too aggressive and that Fed officials are not ready to go along with such market expectations, especially if the economy continues to grow. For the market to expect such a strong reduction in rates, it would have to believe the economy is going into recession and so far, that doesn’t appear to be the case.
We still believe that the Fed is going to cut 25 basis points in September, probably another 25 basis points in November, and potentially another 25 basis points in December. Our argument is consistent with what we see in the economy as employment continues to slow down and inflation continues to approach the 2.0% target rate.
That is, today’s real federal funds rate (nominal fed funds rate minus inflation) is too high and has started to have a negative impact on economic activity, so the Fed is just adjusting its policy rate to take into account these factors. Thus, we now have three 25 basis points cuts this year but will wait for next week’s dot-plot to update our forecast on rates.
But the Fed must deal with several challenging issues today. First, the fiscal tailwinds are still alive and well—the fiscal expansion created by the CHIPS, IRA, and Infrastructure Acts have many years to go. Second, as we said before, employment is slowing down and is affecting economic growth. Third, the rate of inflation has continued to come down and is expected to hit the 2.0% target early next year, and ahead of the Fed’s schedule, according to our calculations. However, shelter costs remain an issue even in this, highly benign inflation environment.
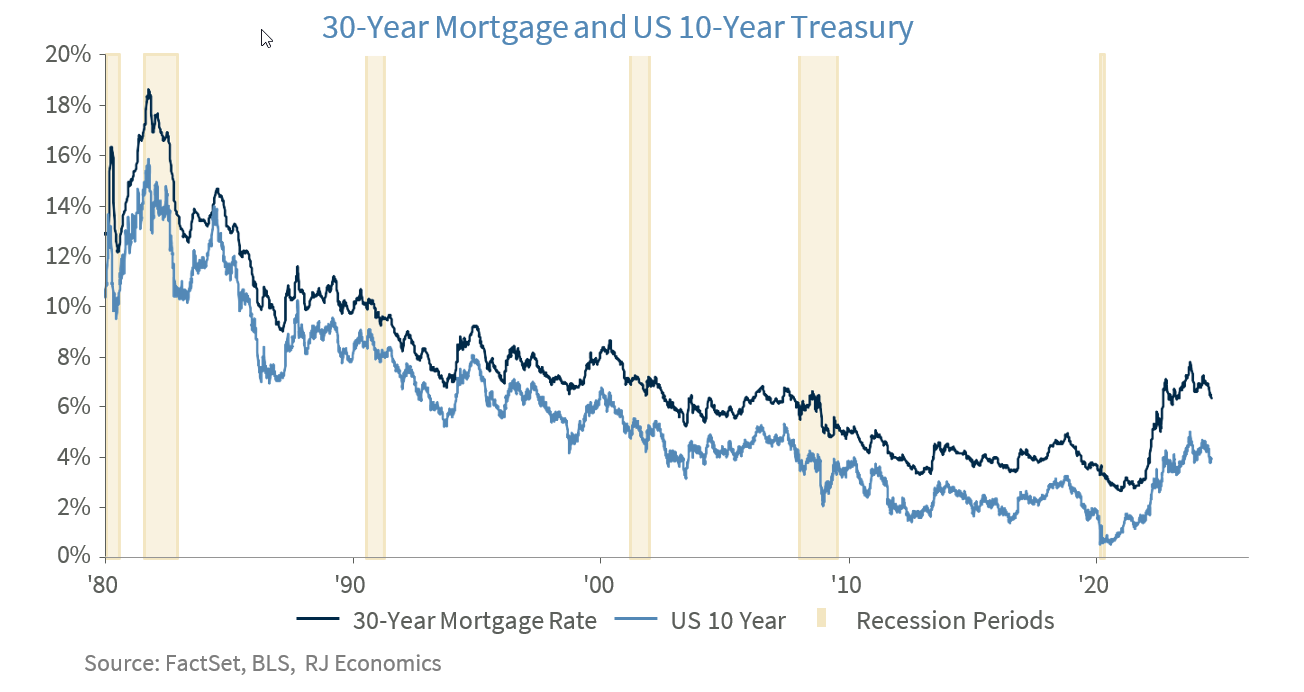
Our argument for a more methodical/slow movement down with rates has to do with shelter costs. Typically, the Fed lowers the federal funds rate to affect long-term rates. The most important of these rates is the 30-year mortgage, which more than doubled over the last several years. But the 30-year mortgage rate has come down already this year as it typically follows the behavior of the yield of the 10-year Treasury. This reduction in the mortgage rate has started to benefit residential investment and the overall housing market.
However, a much lower federal funds rate has the potential for ‘super-sizing’ these effects on the housing market and put further upward pressure on home prices. Thus, we believe that the Fed is going to be very careful as it moves rates lower so it doesn’t create a large mortgage lending cycle that could threaten its inflation target in the years to come.
In conclusion, fiscal expansion will continue to support nonresidential investment, and we believe that the Fed wants to help residential investment. However, it will have to do this with caution, so it doesn’t contribute to a large mortgage lending cycle that will have the potential to send home prices much higher and potentially threaten the inflation target down the road.
Economic and market conditions are subject to change.
Opinions are those of Investment Strategy and not necessarily those of Raymond James and are subject to change without notice. The information has been obtained from sources considered to be reliable, but we do not guarantee that the foregoing material is accurate or complete. There is no assurance any of the trends mentioned will continue or forecasts will occur. Last performance may not be indicative of future results.
Consumer Price Index is a measure of inflation compiled by the US Bureau of Labor Statistics. Currencies investing is generally considered speculative because of the significant potential for investment loss. Their markets are likely to be volatile and there may be sharp price fluctuations even during periods when prices overall are rising.
Consumer Sentiment is a consumer confidence index published monthly by the University of Michigan. The index is normalized to have a value of 100 in the first quarter of 1966. Each month at least 500 telephone interviews are conducted of a contiguous United States sample.
Personal Consumption Expenditures Price Index (PCE): The PCE is a measure of the prices that people living in the United States, or those buying on their behalf, pay for goods and services. The change in the PCE price index is known for capturing inflation (or deflation) across a wide range of consumer expenses and reflecting changes in consumer behavior.
The Consumer Confidence Index (CCI) is a survey, administered by The Conference Board, that measures how optimistic or pessimistic consumers are regarding their expected financial situation. A value above 100 signals a boost in the consumers’ confidence towards the future economic situation, as a consequence of which they are less prone to save, and more inclined to consume. The opposite applies to values under 100.
Certified Financial Planner Board of Standards Inc. owns the certification marks CFP®, CERTIFIED FINANCIAL PLANNER™, CFP® (with plaque design) and CFP® (with flame design) in the U.S., which it awards to individuals who successfully complete CFP Board's initial and ongoing certification requirements.
Links are being provided for information purposes only. Raymond James is not affiliated with and does not endorse, authorize or sponsor any of the listed websites or their respective sponsors. Raymond James is not responsible for the content of any website or the collection or use of information regarding any website's users and/or members.
GDP Price Index: A measure of inflation in the prices of goods and services produced in the United States. The gross domestic product price index includes the prices of U.S. goods and services exported to other countries. The prices that Americans pay for imports aren't part of this index.
The Conference Board Leading Economic Index: Intended to forecast future economic activity, it is calculated from the values of ten key variables.
The Conference Board Coincident Economic Index: An index published by the Conference Board that provides a broad-based measurement of current economic conditions.
The Conference Board lagging Economic Index: an index published monthly by the Conference Board, used to confirm and assess the direction of the economy's movements over recent months.
The U.S. Dollar Index is an index of the value of the United States dollar relative to a basket of foreign currencies, often referred to as a basket of U.S. trade partners' currencies. The Index goes up when the U.S. dollar gains "strength" when compared to other currencies.
The FHFA House Price Index (FHFA HPI®) is a comprehensive collection of public, freely available house price indexes that measure changes in single-family home values based on data from all 50 states and over 400 American cities that extend back to the mid-1970s.
Import Price Index: The import price index measure price changes in goods or services purchased from abroad by U.S. residents (imports) and sold to foreign buyers (exports). The indexes are updated once a month by the Bureau of Labor Statistics (BLS) International Price Program (IPP).
ISM New Orders Index: ISM New Order Index shows the number of new orders from customers of manufacturing firms reported by survey respondents compared to the previous month. ISM Employment Index: The ISM Manufacturing Employment Index is a component of the Manufacturing Purchasing Managers Index and reflects employment changes from industrial companies.
ISM Inventories Index: The ISM manufacturing index is a composite index that gives equal weighting to new orders, production, employment, supplier deliveries, and inventories.
ISM Production Index: The ISM manufacturing index or PMI measures the change in production levels across the U.S. economy from month to month.
ISM Services PMI Index: The Institute of Supply Management (ISM) Non-Manufacturing Purchasing Managers' Index (PMI) (also known as the ISM Services PMI) report on Business, a composite index is calculated as an indicator of the overall economic condition for the non-manufacturing sector.
Consumer Price Index (CPI) A consumer price index is a price index, the price of a weighted average market basket of consumer goods and services purchased by households. Changes in measured CPI track changes in prices over time.
Producer Price Index: A producer price index (PPI) is a price index that measures the average changes in prices received by domestic producers for their output.
Industrial production: Industrial production is a measure of output of the industrial sector of the economy. The industrial sector includes manufacturing, mining, and utilities. Although these sectors contribute only a small portion of gross domestic product, they are highly sensitive to interest rates and consumer demand.
The NAHB/Wells Fargo Housing Opportunity Index (HOI) for a given area is defined as the share of homes sold in that area that would have been affordable to a family earning the local median income, based on standard mortgage underwriting criteria.
The S&P CoreLogic Case-Shiller U.S. National Home Price NSA Index measures the change in the value of the U.S. residential housing market by tracking the purchase prices of single-family homes.
The S&P CoreLogic Case-Shiller 20-City Composite Home Price NSA Index seeks to measures the value of residential real estate in 20 major U.S. metropolitan.
Source: FactSet, data as of 7/7/2023