Spotting the Recession
Bear Markets and recessions go together like Peanut Butter and Jelly, correct? Nope. Although if you watch any type of business media, they talk about the two as if they are one. Let’s just clarify what they both are. A bear market statistically is a 20% or more movement down on a major index (namely the S&P 500) from a previous high. A recession is two negative quarters of Gross Domestic Product (GDP).
The stock market is a predictor of future economic and business conditions. Or at least that’s what it attempts to do. I tell clients, the market is priced today on what it believes earnings from the companies in the index will be 6 to 12, or even 24 months in advance. Any longer than say 30 months ahead, the market really does not give any credence to.

The S&P 500’s move from the September 20th high of 2930.75 to the Christmas Eve low of 2351.10 constituted a 19.78% decline in the index. That’s not a bear, although most of the major publications and even who I would consider market thought leaders are stating that it is. For the sake of their argument, let’s say that the recent decline was the trigger of the last bear market we have had, does this mean that we will be heading for recession? What does that mean for my stocks?
We know what a bear market looks and feels like. 20% down or more in stocks. A recession is a harder thing to picture as it has such a broad meaning. We know its two negative quarters of GDP, but what’s driving it, will the driver affect other areas of the economy and how long will it last? Due to how the GDP data is given, we won’t know we are in a recession till we are already in it for at least 3-6 months. That also means we won’t know we are out of it till after we have been out of it for the same amount of time.
Although the chart below will show you recessions and downward stock markets start around the same time, that data lag measuring a recession has the market moving first. What you also need to remember is that the market will move upwards first before the recession is deemed to be over. Except for the 2000 recession, which in my opinion was driven by extreme valuations, the market moved up well before the end of the economic data release.
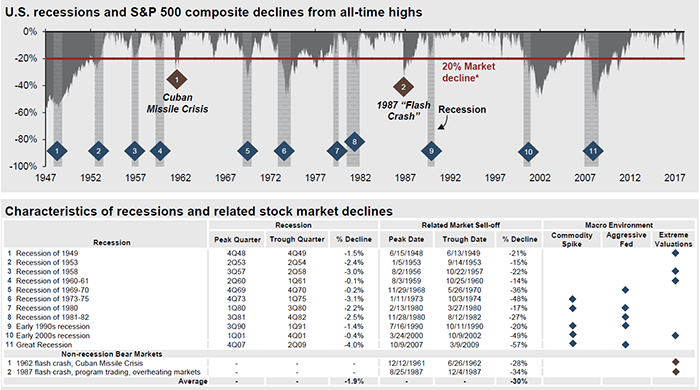
Source: JP Morgan
So, the real question here is how do you spot a recession coming? Because as you see from the chart a recession coincided with bear markets, however bear markets do not always coincide with recessions.
Recession spotting is an important part of what we do, because I’ve always said that it’s easier for a portfolio manager to out-perform on the way down. You don’t have to be 100% in equities, although (unless you use margin) you can’t be more than 100% in equities.
Here are the factors that I look at to provide signals of pending recessions, and yes, this reading may be a little in-depth, but I at least want you to know of its existence.
Average Weekly Manufacturing Hours
Average Weekly Initial Claims for Unemployment Insurance
Manufacturers New Orders, Consumer Goods and Materials
ISM New Orders index
New - Non-Defense Capital Goods e.g., Aircraft
Building Permits
Leading Credit Index
Interest Rate Spread between 10 year and Fed Funds
Average Consumer Expectations for Business Conditions
All data components above are released on a monthly basis, and thankfully the Conference Board correlate this data by way of the Leading Economic Index (LEI). As you’ll see from the chart below taken from the latest LEI release the correlated components have been a pretty good indicator of pending recessions. As of now the indicator is still trending positive, giving me further confidence in our long-term theories.
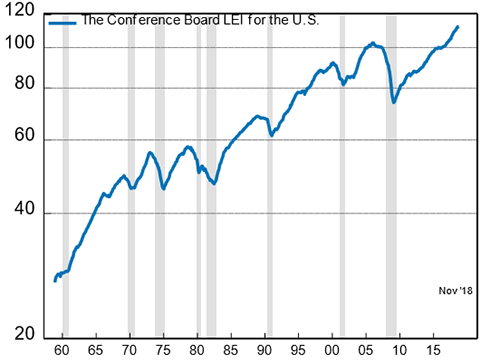
Source: Conference Board LEI Index
Here is a look at the LEI plotted against the S&P 500.

Source: Thomson ONE
I wrote last November on spotting the Bear, I stated bear markets are not swift measures down, they are generally slower grinds lower and need a massive global negative effect, excess sentiment, change in regulation or a total drain on liquidity. Again, I will argue that we did not hit bear market territory, however for the sake of the argument I’ll grant you rounding up and I’ll now answer the second question.
So, what does this mean for my stocks?
When there has been a bear market (or near bear market) without a recession, the return to market highs have been swift. The medium months to return to market highs has been 11 months, with the most recent decline of similar size to what we just went through (2011) taking 4.5 months.
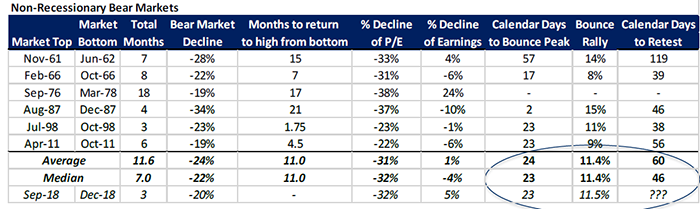
Source: FactSet

To me this “correction” has a feeling somewhere between 2011 and the average of similar declines. That has me predicting reaching all-time highs in around 8.5 months from the low of December 24th. That’s an early fall high. We will see, I guess. The only thing I’m sure of is that in the short term the market will go up, down or sideways, however longer term we have some predictability, and you cannot afford to not be positioned for that long-term return.
Summing up… I still believe we are in the final phase of a long-term secular bull run that has years left to run. The last phases of secular bull markets have tended to provide the best returns. What we have just gone through can be categorized as rare. Rare is good, it creates opportunity...
Sorry to get a little deep this week. With all that said, here’s the Buy/Sell
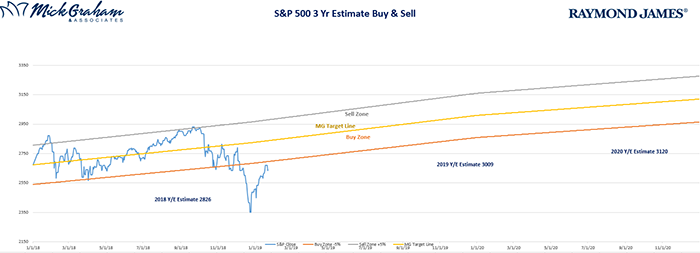
Source: MG&A
Any opinions are those of Mick Graham and not necessarily those of RJFS or Raymond James. The information contained in this report does not purport to be a complete description of the securities, markets, or developments referred to in this material. There is no assurance any of the trends mentioned will continue or forecasts will occur. The information has been obtained from sources considered to be reliable, but Raymond James does not guarantee that the foregoing material is accurate or complete. Any information is not a complete summary or statement of all available data necessary for making an investment decision and does not constitute a recommendation. Investing involves risk and you may incur a profit or loss regardless of strategy selected. The S&P 500 is an unmanaged index of 500 widely held stocks. It is not possible to invest directly in an index. Asset allocation and diversification do no guarantee against a loss. Leading Economic Indicators are selected economic statistics that have proven valuable as a group in estimating the direction and magnitude of economic change.
