All Eyes on International Developed Markets

As a guy who is in the business of managing other people’s money, I’m always on the lookout for value. Value is a relative term, as something that seems cheap today can be even cheaper tomorrow, and that’s the main dilemma for someone sitting in my seat.
Starting with asset classes (stocks, bonds, currencies, commodities, real estate, cash) through the relevant sectors, and eventually individual positions. What’s currently got my attention is international developed markets, and honestly I can’t tell you the last time I’ve said that.
International developed markets are countries that are most developed in terms of its economy and capital markets, be open to foreign investors, have a high income per capita and efficient markets. The layman can say they have had a working stock market for a long period of time. Beyond Developed markets we have Emerging Markets and Frontier Markets, these become a little more complex to identify.
Emerging markets are those nations showing strong and rapid growth and development and have lower income per capita and less developed markets. A frontier market is technically an emerging market, with a much lower income per capita and less liquid capital markets. Based on the above information why would you even bother with Frontier markets? Well, because they have not yet gone through a rapid expansion that markets inevitably go through when maturing. That time frame can mean a big win for investors, albeit with extremely high risks.
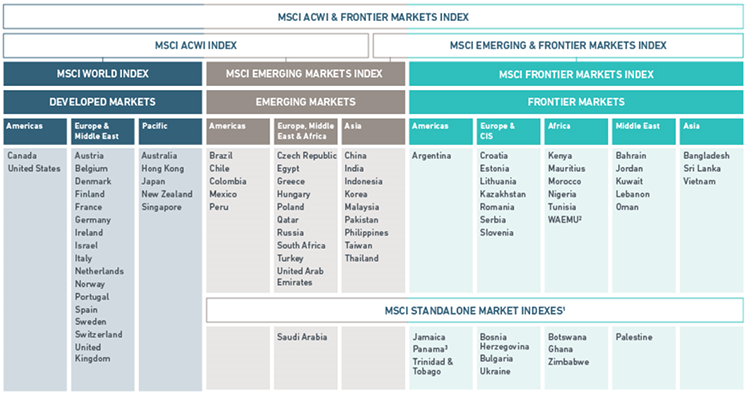
MSCI (an independent institutional research agency) classifies markets into developed, emerging and frontier markets for us. Saving us the man hours of analysis. You may be surprised to see the 2nd biggest economy China on the Emerging markets list. China with its 1.4 Billion people, and recently reported growth rate of 6.5%, blows away that of the developed markets. Why and how can it be still in the emerging category??
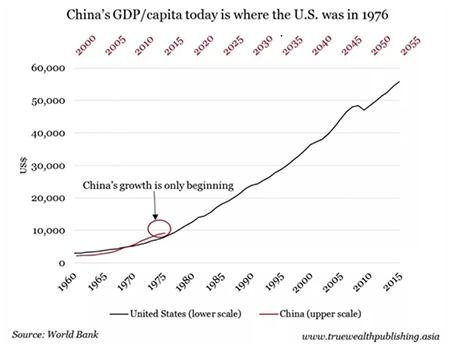
Firstly, their market is still very restrictive, as recently as 2017, China expanded the amount of companies that can be exposed to foreign investment to 222. Most investors up till that stage had to invest in Chinese companies that were listed in the U.S. or Hong Kong Markets. Considering there are over 3300 listed companies in China, they still have a ways to go to be considered an open market. Furthermore, the income per capita is still well behind those countries listed in the developed area. The chart below is an oldie and a goodie that I’ve used several times to highlight where China is in comparison to the U.S.
I digress, the purpose of this article is value in international developed markets. Doing a post mortem of the dismal 4th quarter in the U.S., I looked at the 4th quarter of the International markets both developed and emerging. The long-standing thought has been if the U.S. sneezes the rest of the world catches a cold. So how did they do?
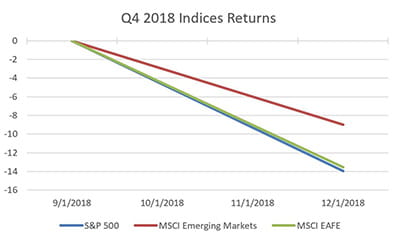
Source: Eikon
As you can see there was a notable outperformance for the rest of the world against the U.S. S&P 500. This has not been the norm. When you simply look at a chart of the U.S. versus the rest of the world’s chart, you can see that since the recession of 2008, the U.S. market has nearly tripled the return.
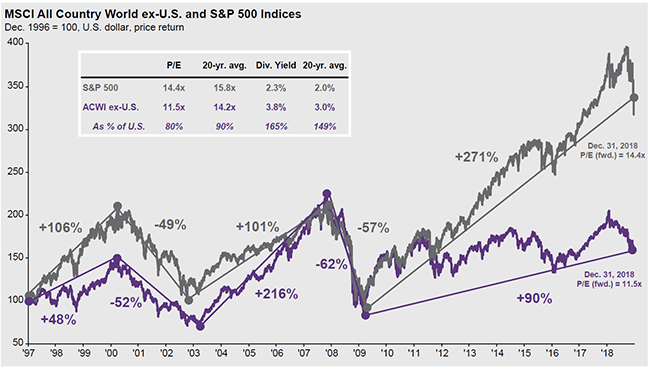
But look a little deeper, there are times in the chart when the U.S. led returns, and there are times when the rest of the world caught up such as the 2003-2007 time frame. The chart below highlights my point even more colorfully.
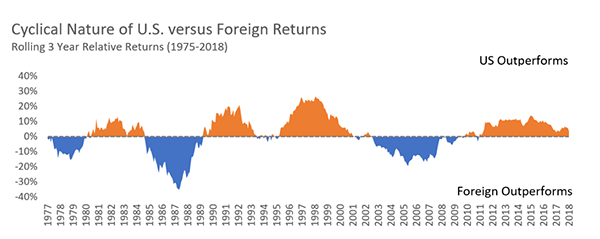
Source: FactorInvestor.com
I’ve written previously about reversion to the means. I personally believe that this chart above will continue to look very similar in the next 30 years, heck I’d even say 100 years.
But back to my initial point of finding value, and if we are ok with the investing globally then let’s look at an historical value. The green box highlights the historic valuation of a market between 1990 – 2018. The Red Triangle is the average through that time, and the blue represents the current valuation.
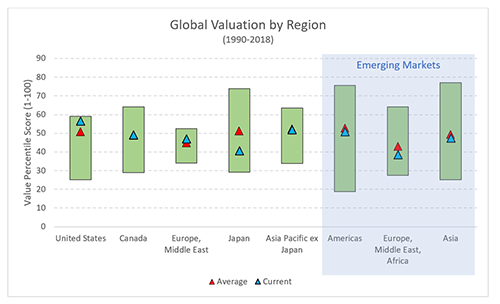
Source: FactorInvestor.com
Is this a definitive measure of value, and a predictor of where outperformance will be next year? Absolutely not. I’m simply highlighting the areas that deserve a further examination. We now operate in an $80 Trillion global market with growth rate of around $4 Trillion. A great chart by the world economic forum puts it into perspective.
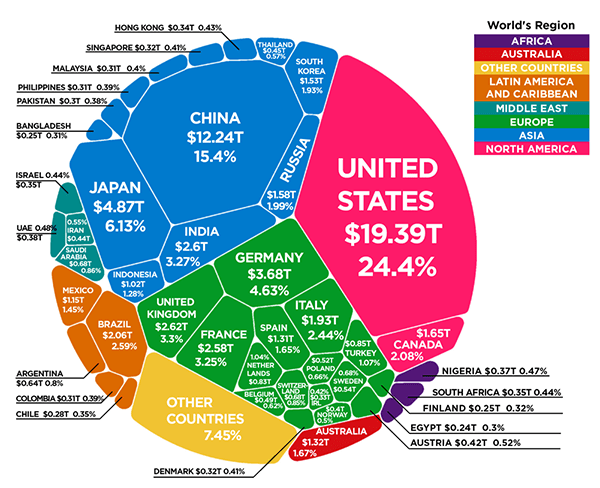
Source: VisualCapitalist.com
I’m not prepared to go out on a limb yet to predict international will outperform the U.S., however I will say that I think we are getting closer to most of the news and issues including but not limited to Brexit, Trade Deals and European Banks being priced into the markets. The next step after that: Reversion to the Mean…

With that, just a quick jab to our Fed Chairman, who to me is acting like a boxer coming out for round three after getting punched senseless in round two. A total reversal in his comments and tone. You may recall that after his comments in November the markets took an 8% dump. I’m sure his trainer told him move and not stay in the one spot with your chin out. If he hadn’t stuck his foot in it so badly last year, he wouldn’t have to tap dance around now.
With all that said, here is the buy/sell.
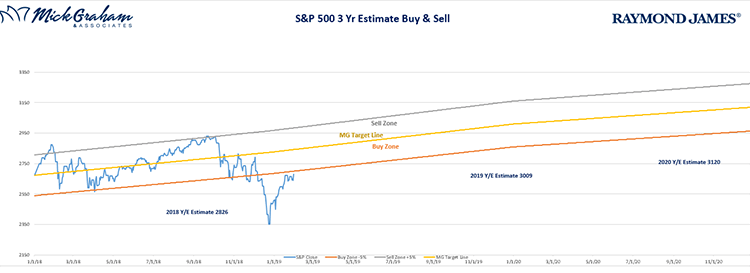
Source: MG&A
My goal aside from managing clients’ portfolios is to educate them on the process and discipline of investing. My writings are an attempt to put some simplicity around an industry that attempts to make it laborious and is self-righteous.
Any opinions are those of Mick Graham and not necessarily those of RJFS or Raymond James. The information contained in this report does not purport to be a complete description of the securities, markets, or developments referred to in this material. There is no assurance any of the trends mentioned will continue or forecasts will occur. The information has been obtained from sources considered to be reliable, but Raymond James does not guarantee that the foregoing material is accurate or complete. Any information is not a complete summary or statement of all available data necessary for making an investment decision and does not constitute a recommendation. Investing involves risk and you may incur a profit or loss regardless of strategy selected. The S&P 500 is an unmanaged index of 500 widely held stocks. The MSCI ACWI (All Country World Index) Index is a free float-adjusted market capitalization weighted index that is designed to measure the equity market performance of developed and emerging markets. As of June 2007 the MSCI ACWI consisted of 48 country indices comprising 23 developed and 25 emerging market country indices. The developed market country indices included are: Australia, Austria, Belgium, Canada, Denmark, Finland, France, Germany, Greece, Hong Kong, Ireland, Italy, Japan, Netherlands, New Zealand, Norway, Portugal, Singapore, Spain, Sweden, Switzerland, the United Kingdom and the United States. The emerging market country indices included are: Argentina, Brazil, Chile, China, Colombia, Czech Republic, Egypt, Hungary, India, Indonesia, Israel, Jordan, Korea, Malaysia, Mexico, Morocco, Pakistan, Peru, Philippines, Poland, Russia, South Africa, Taiwan, Thailand, and Turkey. MSCI Emerging Markets Index is designed to measure equity market performance in 23 emerging market countries. The index's three largest industries are materials, energy, and banks. It is not possible to invest directly in an index. Asset allocation and diversification do no guarantee against a loss. Leading Economic Indicators are selected economic statistics that have proven valuable as a group in estimating the direction and magnitude of economic change. Investing in emerging markets can be riskier than investing in well-established foreign markets. Investing involves risk and investors may incur a profit or a loss.
https://www.weforum.org/agenda/2018/10/the-80-trillion-world-economy-in-one-chart/
https://www.factorinvestor.com/blog/where-is-the-value
https://www.quora.com/Why-is-China-an-emerging-market-when-its-the-second-largest-economy-in-the-world
https://www.usatoday.com/story/money/2017/06/22/playing/415307001/
