2019 Forecast: Save Your Fingernails

First, I actually got rid of the term Forecast a couple of years ago, as I had some people point out that I forecast a number of the S&P 500 and I missed it by that much. I prefer to call it “Fair Value”. As you’ve no doubt witnessed (especially in the past three months), markets move for several reasons and for no reason at all. Aside from the fact that trying to predict what a Stock Market Index will be at a certain point on the calendar is asinine, it sets you up for constant failure. And yes, it’s a preamble for the fact that my fair value for the S&P 500 for the end of 2018 was 2826, which was around 11% below where I thought it should be.
In my defense for 2018, by my count the value of the stock market touched my fair value line 11 times, which I think is a personal best. That was until November 11th when we went on a free fall. Headlines creating uncertainty included Global Trade (specifically China), Brexit, Government Funding & ultimate shutdown, Privacy Issues, Executives being Prosecuted around the globe, and last but certainly not least – The FED.

It’s enough to give you tightness in the chest.
I will pause for a moment now to say that I did not get many emotional calls over the past two months, so I’m a very proud Financial Advisor at this time. It means that you were either too busy to notice, didn’t care, or have become numb to my responses. Either way, great job. You did not make the mistakes of the average retail investor, who has historically sold low and bought high. The movements in the indexes for the past three months are typical of how easy it would be to fall victim to the emotional trade. We had at least three 750 plus point down days on the Dow, but that was also followed by the biggest up day in history on December 26 with over 1000 points. This is why I continue to add the chart below in my writings, that shows if you have missed the 10 best days in the market over the past 15 years, you would have cut your portfolio in half.
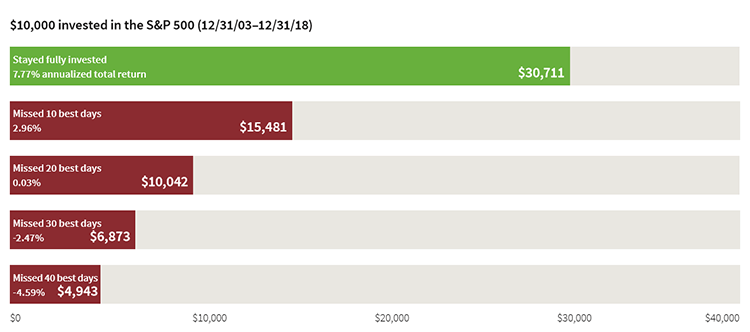
Source: Putnam.com
So 2019… I’ll start by saying that I have not changed my longer-term outlook. It’s the same numbers I published last year. Year End 2019 S&P 500 “3009”. What has changed is what I think the markets will return this year. What was originally a 6% return in the markets this year, is now 20%, given the drop we experienced in the past few months.

Now to address some of the headlines/threats that the market has been placing value on, I only see one having a lasting effect. I believe we will have a resolution to the shutdown, trade deals and Brexit. I don’t believe the Fed will have the ability to surprise the market any more, but I do feel that Privacy issues will have some effect on earnings. It’s a push/pull scenario as we as a society look to manage the benefits of centrally stored data and risks associated with personal information floating in the cloud. Ultimately, I see regulation being increased in the tech space, which if history is any guide has the potential to restrict earnings. That being said, there is more innovation in the technology space, than other regulated industries (i.e. financials), and that will provide an opportunity to keep earnings on a growth path.
My bullish views for 2019 are fundamentally based, however some historical data I believe also supports my thesis. After a down market in a calendar year, the following year has averaged 12.4%. If you look at bear market years (which most argue we just had, although we did not hit 20% from a closing high) that have not been combined with a recession, the 12 months following have averaged a 29% return. Historically the response to weak markets is strong markets. Source: USA Today
I also think the drive down into year end was driven by hedge fund liquidations. These funds in my humble opinion have the ability to move markets in the short term. My basis for this is due to the fact that the low for the year, was the closest I’ve ever seen to year end. I don’t think that was a coincidence.
Summing up, I’m proud of you for not trying to change course. I predict that volatility may stay high, maybe not as high as we’ve just seen, however the low volatility environment is clearly in the rear-view mirror.
With that here’s the buy sell.
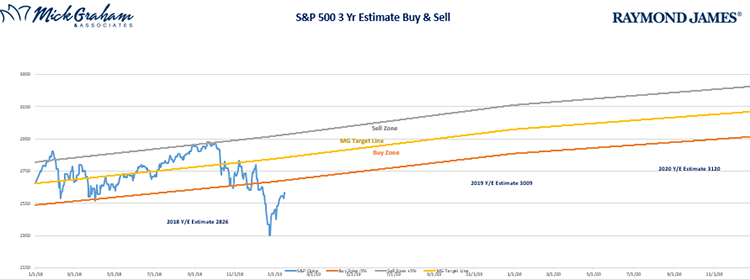
Source: MG&A
Any opinions are those of Mick Graham and not necessarily those of RJFS or Raymond James. Expressions of opinion are as of this date and are subject to change without notice. The information has been obtained from sources considered to be reliable, but we do not guarantee that the foregoing material is accurate or complete. There is no assurance any of the trends mentioned will continue or forecasts will occur. The S&P 500 is an unmanaged index of 500 widely held stocks that is generally considered representative of the U.S. stock market. Inclusion of these indexes is for illustrative purposes only. Keep in mind that individuals cannot invest directly in any index, and index performance does not include transaction costs or other fees, which will affect actual investment performance. Individual investor's results will vary. Past performance does not guarantee future results. Investing involves risk regardless of the strategy selected.
