It’s Just Math

Last week was highlighted as a milestone for the U.S. financial markets, with the media reporting that this is now officially the longest bull market in history, eclipsing the previous record of 3,453 days. A bull market, by definition, is a period without a 20% downturn, and our current run started with the indexes (I follow the S&P 500) hitting bottom on March 9th, 2009 with the index at 666. Spooky right??!!!!

You know the thing I loved about math in school was that there’s no grey areas. It’s either right or it’s wrong. Unlike my English papers that were subjective, math gave you the satisfaction that you either solved the puzzle and got it right, or you got it wrong and you went back and discovered your error and fixed it. I’ve always loved that about my job, numbers are numbers, it’s just math. Until the media gets involved.
 In this current bull run, by my calculations we had an intraday low back in October 2011 from April 2011 of 21.6%, which would shave around 700 days from the current bull run. OK the argument there is that it only counts if it’s and end of day number, not an intra-day number. OK, what about the roaring 90s, which by most accounts started on October 11th, 1990? Again, by my calculations, the drop from the previous high in 1990, was 19.9%. Close to 20% technically, but no cigar. To go back to the previous 20% drop you would need to go to 1987, which adds another 1000 days top the 90s bull run, and therefore leaves us well short of the longest bull run. But hey, don’t let the facts get in the way of a good story.

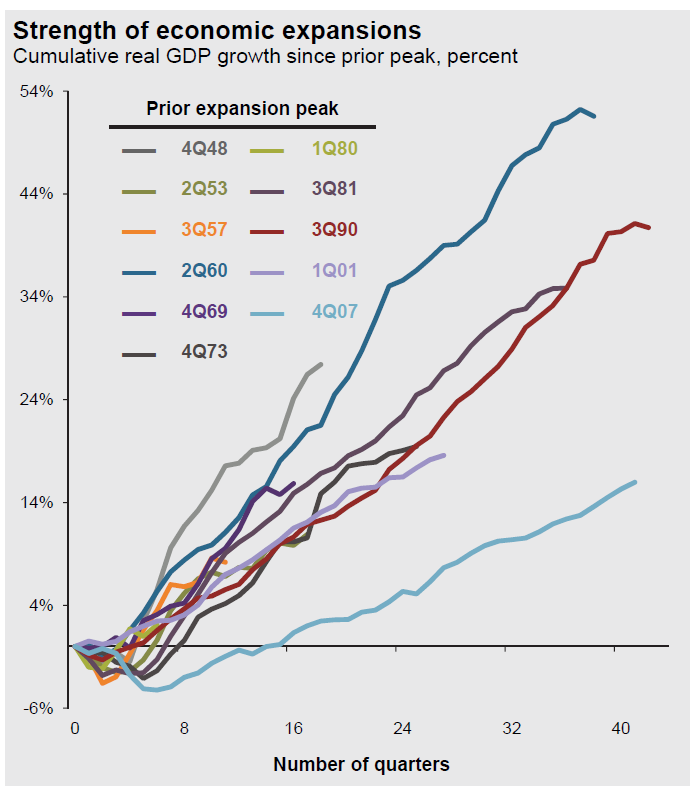
Either way you look at it, this is, and will be one of the longest bull runs in history, albeit somewhat placid. The incredible 323% return so far since 2009 is nothing to be sneezed at, however it still falls behind the 90s rally, and is below the average yearly return of bull markets according to FactSet. JP Morgan shows a chart quarterly on the length and breadth of economic expansions since the previous peak and this time around is the slowest on record.

Source: JP Morgan


In summary, I don’t want you to digest the media’s scare tactic based on some arbitrary date that this is the end of this run. Bull markets don’t end of old age, they end on some event that stalls corporate profits. From where I sit, that time is still some time away.
Here’s the buy/sell

Source: MG&A
As always should you have any questions or concerns, please don’t hesitate to call.

The S&P 500 is an unmanaged index of 500 widely held stocks that’s generally considered representative of the U.S. stock market. The Dow Jones Industrial Average (DJIA), commonly known as “The Dow” is an index representing 30 stocks of companies maintained and reviewed by the editors of the Wall Street Journal. One can not invest directly into an index. Index performance does not include transaction costs or fees, which will affect actual investment performance. Individual investor’s results will vary and past performance does not guarantee future results. Investing involves risk and investors may incur a profit or loss.
Any opinions are those of Mick Graham and not necessarily those of RJFS or Raymond James. Expressions of opinion are as of this date and are subject to change without notice. Any information is not a complete summary or statement of all available data necessary for making an investment decision and does not constitute a recommendation. The information has been obtained from sources considered to be reliable, but Raymond James does not guarantee that the foregoing material is accurate or complete.

