Secular Bull Markets Part II

I wrote about Secular Bull Markets back on February 6th of this year. Click here to access the article. The volatility we witnessed in the past 7 trading days caused me to field some questions on whether markets at this level are sustainable. So, I thought this week I would re-visit what a secular bull market is, look at some past secular bull markets and add a few more reasons behind why I feel this market has a long way to run.
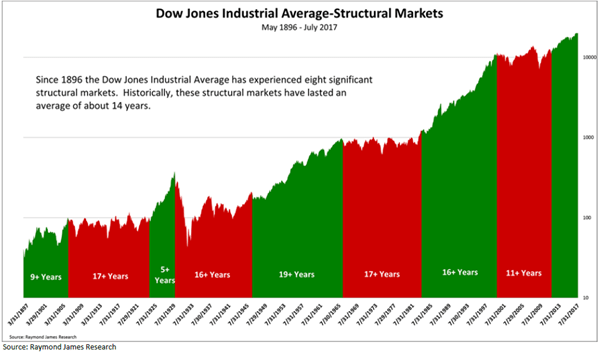
The definition of a secular bull market is a long sustained upward trend that can last anywhere between 5-25 years. The reasons behind these moves are generally multiple, large scale and global. Secular bull markets can have bear markets inside them (a bear market being described as a 20% pullback from a high) but it will not reverse the overlying trend upwards. Most market analysts consider the 80s and 90s to be a secular bull market even though we experienced Black Monday on October 19, 1987.

Here are a few reasons for our thoughts:
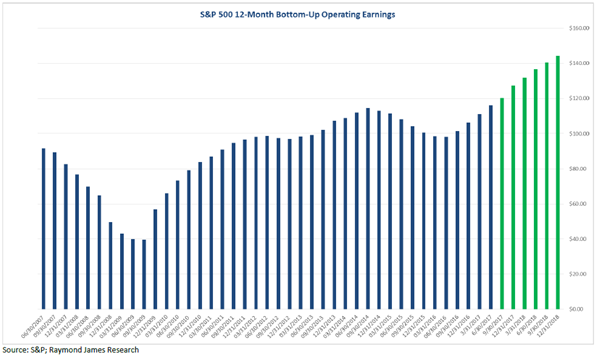
- S&P earnings bottomed from the recent dip in 2016 and are surpassing all-time highs and consensus for the next 6 quarters are higher.
- Although U.S. growth is growing, globally the economy is continuing to improve.
- Interest rates are still low and although the fed has raised we are still in “easy money” mode when compared against history.
- Inflation is under control and we are not seeing any data to think that it will surprise any time soon.
- Investor sentiment, a measure of exuberance is still negative. I measure this through fund flows.
- I feel earnings have had a bigger impact on the market run than political agendas. We initially had some exuberance but I feel that has diminished. Any long-term tax changes can assist the market for many more cycles.
- Bond Fund Flows. These have reversed after many years and trillions of dollars flowing into them. If I’m truly concerned about anything it is investors that are invested in long term bond funds.
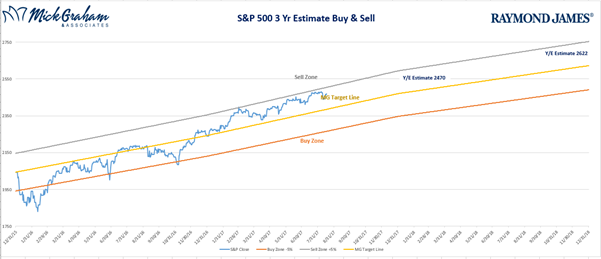
The charts below are updated from the Feb 6th article. Although the buy/sell looks a little different, the Dow Structural Markets chart hasn’t changed a great deal, which I feel highlights how much longer we have to run.


Source :MG&A
That’s it for this week. As always should you have any questions please don’t hesitate to contact us.
Regards

Any opinions are those of Mick Graham and not necessarily those of RJFS or Raymond James. Expressions of opinion are as of this date and are subject to change without notice. The S&P 500 is an unmanaged index of 500 widely held stocks that is generally considered representative of the U.S. stock market. Inclusion of these indexes is for illustrative purposes only. Keep in mind that individuals cannot invest directly in any index, and index performance does not include transaction costs or other fees, which will affect actual investment performance. Individual investor's results will vary. Past performance does not guarantee future results. Holding stocks for the long-term does not insure a profitable outcome. Investing in stocks always involves risk, including the possibility of losing one's entire investment. There is no guarantee that any statements, opinions or forecasts provided herein will prove to be correct. The information contained in this report does not purport to be a complete description of the securities, markets, or developments referred to in this material. The information has been obtained from sources considered to be reliable, but we do not guarantee that the foregoing material is accurate or complete.

