Charting the Course

There are two major schools of thought when it comes to making recommendations on the stock market. Technical analysis and Fundamental analysis. I would classify myself as a fundamentalist, which is the study of attempting to measure a securities value based on its financial data such as earnings, management forecasts and sales results. Technical analysis is the evaluation of a securities value based on market activity such as price and volume and looks for trends and patterns that suggest what the price will do in the future. Some call this charting, and I formally called it reading tea leaves.
I thought it was crazy to try to predict a security or an indexes future movement without giving any thought to sales and the economic cycle and plans the execution of company strategy. Being an avid reader of Benjamin Graham (Warren Buffet’s mentor) and attaining my Certified Portfolio Managers designation from Columbia University where Ben Graham taught, fundamental analysis I have felt for a long period was the only method to go by.
As I get older and somewhat wiser, I have included quite a bit more technical analysis in my daily reading than I would care to admit. I still do not use charting on individual stocks but rather the overall market. And rather than try to look at patterns in charts, I focus on major data points. Don’t fall asleep yet I’m getting there…

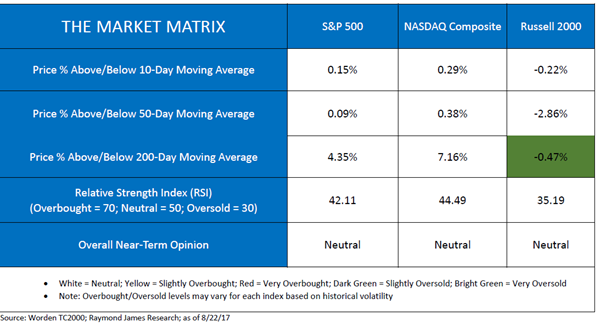
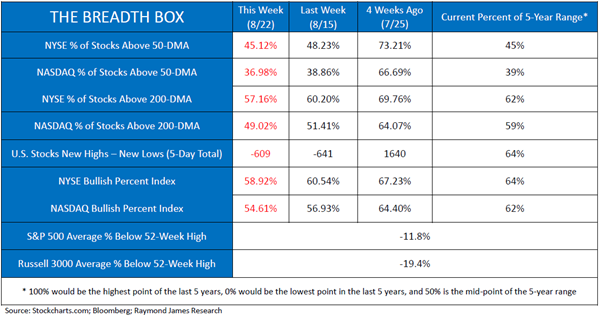
So, this week I want to highlight a technique used in technical analysis called market breadth. Market breadth analyzes the number of companies advancing relative to the number of companies declining in an index. For example, the S&P 500 (Index of the top 500 US companies) each week we can get many statistics that can provide some interesting data and assist us in identifying shorter term trends. Here are a few examples:
- 52 Week Highs & Lows (The percentage of securities at 52-week highs v 52-week lows a given index)
- % of securities above and below their 50 & 200 day moving average.
- Volume (which is the number of shares that are sold compared against the daily average)
- Advance Decline Line (shows how many components of an index is contributing to its move one way or another)
What analysts are attempting to create with these data points are overbought or oversold signals. They are attempting to provide statistics that can help you make decisions whether to protect or look for opportunities. These signals however are generally very short term, and don’t fit my method of managing money all that well. That said I do use them to confirm some current thinking or as a reason to research further. Im giving you this information as part of my goal to educate you on the process. This although a small part is still worth mentioning. Its easy to get lost in all this data and if your so inclined there are many websites that you can go to that will allow you to create some charts for free. Stockcharts.com is one I’ve used.


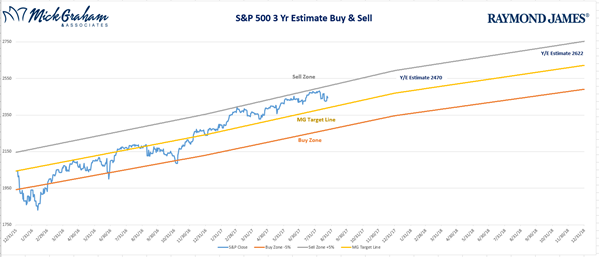
Our BUY/SELL CHART
One chart I do create for you each week is what we call the buy/sell. I was explaining this chart to one of the team here, and I realized that I may not have explained the chart to you that well. I created this chart to show you visually where I think the market (S&P 500) will be for the next 12-24 months. I base this forecast on the earnings of the companies within the index. I have drawn a line from the starting price of the index to where I think it will end (called the Mean Line). Then I have put a line 5% above and 5% below the mean line. I’m hoping you will take a few things from this chart:
- Tell you what my long-term forecasts are.
- Provide a visual reference when you hear that the market is expensive or when it’s cheap.
- Reverse what emotion tells you. “Buy when others are scared and sell when others are greedy.” –Warren Buffet

Source: M&A
Have a great week. As always don’t hesitate to call with any questions.
Regards,

The Russell 2000 Index is a small-cap stock market index of the bottom 2,000 stocks in the Russell 3000 Index. The Russell 2000 Index is an unmanaged index of small cap securities which generally involve greater risks. The NASDAQ Composite is a stock market index of the common stocks and similar securities listed on the NASDAQ stock market. The S&P 500 is an unmanaged index of 500 widely held stocks. The NYSE Bullish Percent Index is an index that measures the percent of NYSE stocks that are in point & figure uptrends. The NASDAQ Bullish Percent Index is an index that measures the percent of NYSE stocks that are in point & figure uptrends. The NASDAQ Bullish Percent Index is an index that measures the percent of NASDAQ stocks that are in point & figure uptrends. The Russell 3000® Index measures the performance of the 3,000 largest U.S. companies based on total market capitalization, which represents approximately 98% of the investable U.S. equity market. Inclusion of these indexes is for illustrative purposes only. Past performance may not be indicative of future results. It is not possible to invest directly in an index. Opinions expressed are those of the author Mick Graham, and not necessarily those of Raymond James. The information contained was received from sources believed to be reliable, but accuracy is not guaranteed. Investing always involves risk and you may incur a profit or loss. No investment strategy can guarantee success. The charts and/or tables presented herein are for illustrative purposes only and should not be considered as the sole basis for your investment decision.

