Volatility Returns
Last week we witnessed the biggest one day sell off since the election. The Nasdaq Composite and Russell 2000 wore the brunt of it, however the Dow and S&P 500 felt it mainly through the financial sector. News articles attributed the pull back as the markets being concerned that some of the administrations agenda would not pass as intended, and/or take much longer to achieve. All this should not be news to anyone, the system was designed with checks and balances (or roadblocks) and negotiations will continue and compromises given, all in all it won’t be quick.
One of the charts that we have been using lately highlights the fact that the market had not had a retracement from highs of greater than 2% on the S&P 500 since the election. That trend was broken last week, with a 2.37% below its previous high on March 1.
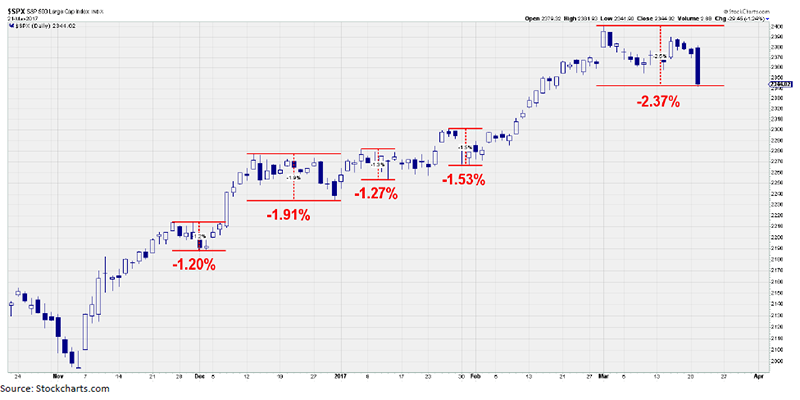
Another interesting stat is that the decline of last Tuesday broke a 109-day streak without a 1% decline. This is the longest streak since 1995, and was only two days away from breaking that streak.
What does this all mean? Markets don’t ride continually upwards; 5% pullbacks are normal in any bull run and by my estimation happen between 2-3 times a year during sustained rally’s. Although I still believe we are in the midst of a long-term bull run for stocks, I’m a little more cautious on the short term. Raising a little cash in this environment is prudent.

I do want to state that although I’m cautious, I don’t think that this will lead to a pullback into Bear Market territory. Bear markets generally don’t happen overnight and indicators generally show themselves some time before the damage is done. RJ research put out a nice chart this week highlighting the “Advance Decline Line” and its correlation to predicting a major market move. The Advance-Decline line is an indicator that measures the number of individual stocks participating in a market rally or sell-off. The indexes like S&P 500 and Dow, can get disproportionate given that the larger companies can have a larger impact. The AD line measures each company equally, so it’s a measure of how broadly a market is moving one way or the other. You’ll see below that the AD line showed signs of decline prior to the S&P 500 index moving during the 2008 financial crisis.

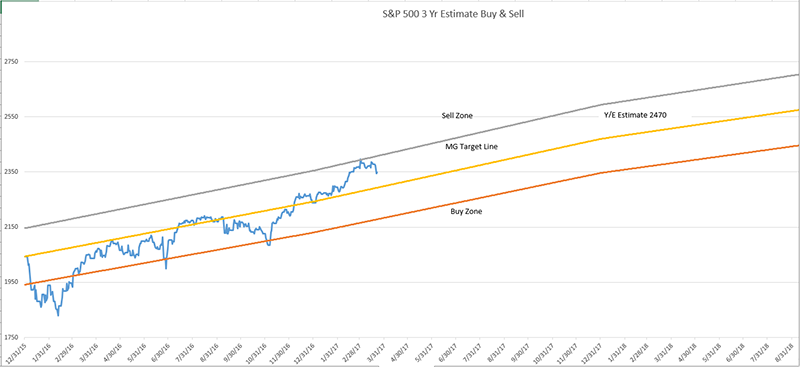
Two weeks ago, we highlighted the buy/sell sheet hit the high point of our graph for the first time in over two years. We are still very comfortable with our year end forecasts of 2470 on the S&P 500 given how earnings have come from Q 4 and what we are hearing regarding guidance for the current quarter.
Here is the Buy/Sell for last week.
Source: MG&A
All in all, a little caution is warranted, and we will be watching a little more closely. As always if you have any questions or concerns, don’t hesitate to call.
Have a great week,

Any opinions are those of Mick Graham and not necessarily those of RJFS or Raymond James. Expressions of opinion are as of this date and are subject to change without notice. The S&P 500 is an unmanaged index of 500 widely held stocks that is generally considered representative of the U.S. stock market. Inclusion of these indexes is for illustrative purposes only. Keep in mind that individuals cannot invest directly in any index, and index performance does not include transaction costs or other fees, which will affect actual investment performance. Individual investor's results will vary. Past performance does not guarantee future results. Holding stocks for the long-term does not insure a profitable outcome. Investing in stocks always involves risk, including the possibility of losing one's entire investment. There is no guarantee that any statements, opinions or forecasts provided herein will prove to be correct. The information contained in this report does not purport to be a complete description of the securities, markets, or developments referred to in this material. The information has been obtained from sources considered to be reliable, but we do not guarantee that the foregoing material is accurate or complete.
