Rate the Curve
Fed minutes released last week showed the strongest signal yet that the decision to raise rates could come as early as next month, citing an improving economy and the possibility of more spending and less taxing by the administration.
The latest Fed indications still show an expectation to raise 3 times this year, although I concede that this was also the expectation for the last two years. However, this time around data is a lot closer to their “goals” than in the past including unemployment figures. The committee will have two more major data points to review prior to their March 14 & 15 meetings.
They indicated in the minutes that they could adopt a more aggressive timetable should they need to keep a lid on inflation.
So, what does this mean for the average investor? I see it as a good sign for the equity markets and a very cautious sign for the fixed income or bond market. I use the word cautious as it’s not necessarily bad, rather challenging and attention needs to be paid. We have been spoiled with interest rate decline for the past 3 decades and I believe that we could see the opposite at least through this political cycle.
Now a quick 101 on fixed income investing.
As yields go up, the price of bonds go down. In its simplest form, if I can buy a 4% bond today for 1000, and if rates go up by 1 percentage point, I can now buy a 5% bond for 1000. That means the 4% bond you own will drop in price to provide an equivalent yield for the investment.
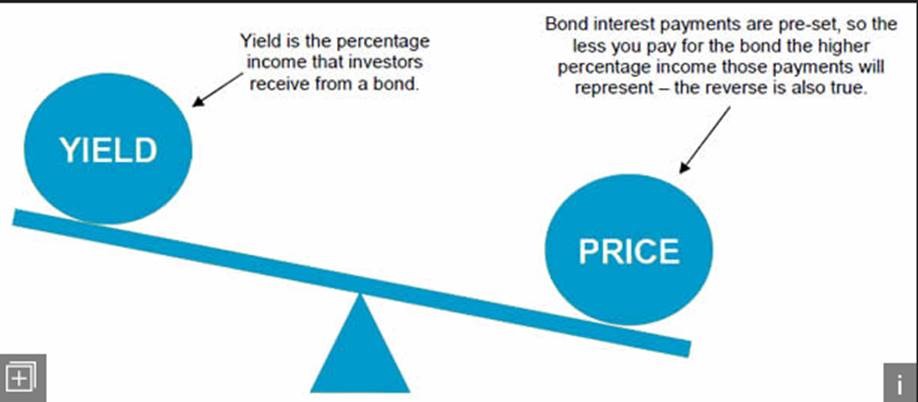
Source: legalandgeneral.com
Risks – Duration v Credit
Bonds are priced based on risk and duration. US treasuries considered government guaranteed provide a lower yield than a bond secured by a small corporation. This is credit risk. Bonds that have longer time to mature should (with all else being equal) provide a higher yield than a bond with less time to mature. This is duration Risk.
When we graph this, it produces the yield curve
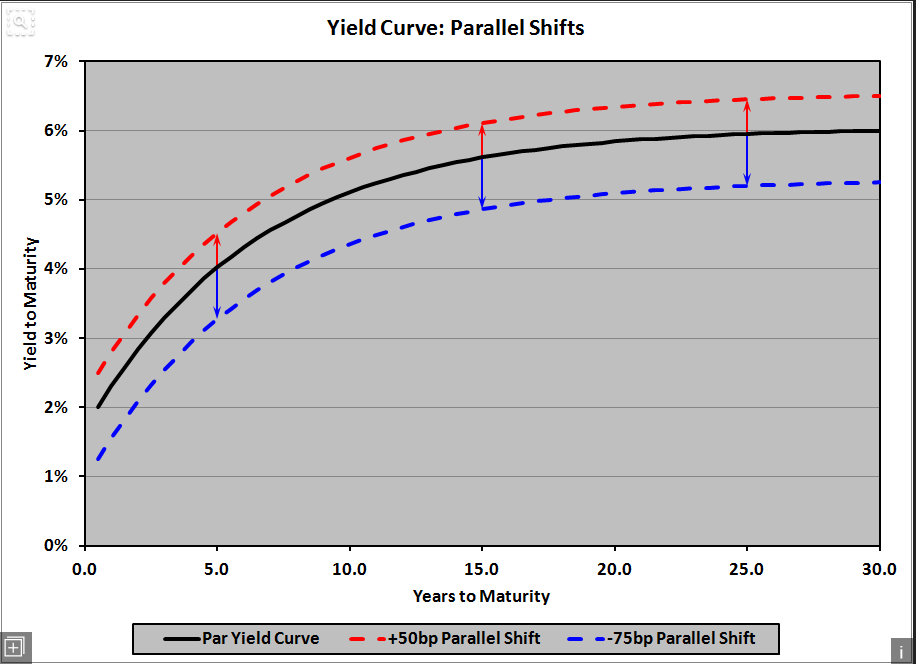
Source financialexamhelp123.com
This is a hypothetical example for illustration purposes only and does not represent any actual investment
When determining how long to buy a bond for we look to purchase the steepest part of the yield curve. As you can see from the graph above you receive approximately 4% for a 5-year duration and approximately 5% for 10 years. You go all the way out to 30 years to get an additional 1%.
When the fed raises rates, it affects the shorter end of the curve. Despite news to the contrary the Fed only controls two things The Fed Funds rate, which is the rate at which banks lend their money deposited at the federal reserve to each other, and the Fed Discount Rate, which is the rate that banks borrow from the fed. The rest of the curve is controlled by the market. This is how banks make money, borrow short term from the fed and loan to you on the longer end in very very basic terms.

So, if bond prices go down as rates rise it becomes a fight between the yield you receive and the amount of depreciation you incur as markets move. Strategies to implement in these environments.
- Owning bonds that mature at different times. As they are called or mature you have cash to go and buy the longer end of the curve.
- Maturity… Own bonds that mature. i.e. own individual bonds rather than bond mutual funds. I am against owning bond funds especially long term bond funds in a rising interest rate environment. In a lot of cases the bond fund will not own the bond to maturity as their charter to be a “long bond fund” will force the managers to sell the bond to maintain a “long duration” status.
- Monitor the yield curve. The steepest part of the curve will move as rates change. And most of the movement will be prior to any Fed decision.
A balanced portfolio needs to have a component allocated towards fixed income to assist with volatility. In these environments when stock markets have run so far, it’s easy to not rebalance and put more into an asset class that looks like it’s in for a tough time, but I believe this is exactly what prudent investing is all about.
Now on equity markets we have seen 8 highs in a row for the major indexes up to last Thursday. Getting close to the higher end of our sell line, but still in the ranges.
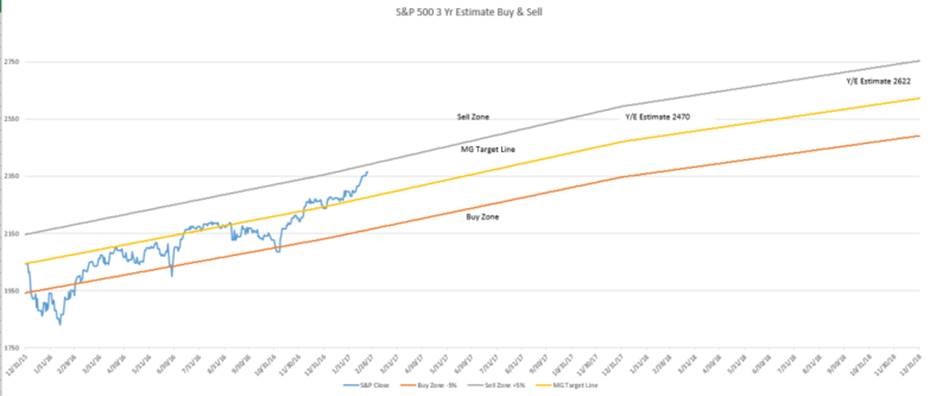
Source MG&A
As always should you have any questions or concerns, please don’t hesitate to give us a call

Mick Graham CPM
Branch Manager
Raymond James Financial Services.
T 321.610.3200 // C 321.474.5263
3270 Suntree Blvd, Suite 129, Melbourne FL 32940
Securities offered through Raymond James Financial Services, Inc., Member FINRA/SIPC
Raymond James Financial Services does not accept orders and/or instructions regarding your account by e-mail, voice mail, fax or any alternate method. Transactional details do not supersede normal trade confirmations or statements. E-mail sent through the Internet is not secure or confidential. Raymond James Financial Services reserves the right to monitor all e-mail. Any information provided in this e-mail has been prepared from sources believed to be reliable, but is not guaranteed by Raymond James Financial Services and is not a complete summary or statement of all available data necessary for making an investment decision. Any information provided is for informational purposes only and does not constitute a recommendation. Raymond James Financial Services and its employees may own options, rights or warrants to purchase any of the securities mentioned in e-mail. This e-mail is intended only for the person or entity to which it is addressed and may contain confidential and/or privileged material. Any review, retransmission, dissemination or other use of, or taking of any action in reliance upon, this information by persons or entities other than the intended recipient is prohibited. If you received this message in error, please contact the sender immediately and delete the material from your computer.
Any opinions are those of Mick Graham and not necessarily those of RJFS or Raymond James. Expressions of opinion are as of this date and are subject to change without notice. The S&P 500 is an unmanaged index of 500 widely held stocks that is generally considered representative of the U.S. stock market. Inclusion of these indexes is for illustrative purposes only. Keep in mind that individuals cannot invest directly in any index, and index performance does not include transaction costs or other fees, which will affect actual investment performance. Individual investor's results will vary. Past performance does not guarantee future results. Holding stocks for the long-term does not insure a profitable outcome. Investing in stocks always involves risk, including the possibility of losing one's entire investment. There is no guarantee that any statements, opinions or forecasts provided herein will prove to be correct. The information contained in this report does not purport to be a complete description of the securities, markets, or developments referred to in this material. The information has been obtained from sources considered to be reliable, but we do not guarantee that the foregoing material is accurate or complete.
