20,000 & Beyond!!!!!!!!
The Dow Jones Industrial Average (Dow) goes through the feared and revered 20,000 mark. It’s amazing what emotions a number can bring. I’ve had several conversations focusing around the new high and how the market is expensive.
To get some perspective I looked up what the Dow was when I was born. November 15,1970 (which happened to be a weekend) The Dow closed that Friday at 759.79. The first time it hit the 1,000 mark was exactly 2 years later. At every stage of these historical landmarks, no doubt the same comments were being made.
The Dow, I hate to say, in my opinion, is a terrible measure of the overall market measure. In fact, a lot of people don’t know that the Dow measures only 30 stocks, and the selection of which companies get in the index is somewhat arbitrary. The companies in the Dow are selected by editors of the Wall Street Journal and are picked on the basis that these companies are the “leaders of the economy.
The calculation is made on the stock price rather than the market cap of the company. There are arguments that the Dow is not actually even accurate. There was a great article in the Wall Street Journal last Thursday by James Mackintosh that highlighted some of the flaws and he argues that the Dows real index value is 30,000 due to an error back in 1914 when the market was closed for four months during the start of World War I.
Although the Dow is still used by the media and most of us, the S&P 500 is an index used by most money managers as a better representation of large cap American equities. The companies selected for thisindex are done by a committee made up of analysts and economists and is based mainly on market cap, liquidity and industry groping.
Why are these indexes important? Because you should always measure the amount of risk you are taking compared to the return you are getting. This is the reason each quarter we measure our returns against a relative index.
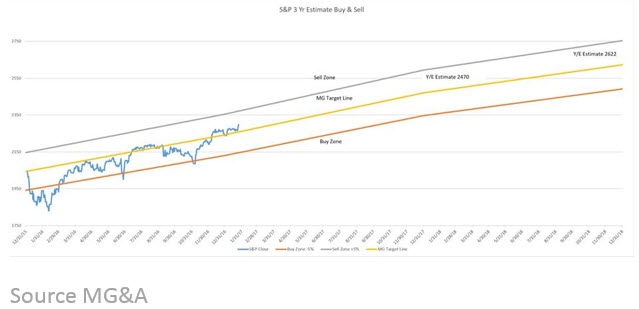
So, what from here??? Dow 30,000 then Dow 40,000 and so on. Yes, that’s right…. This is part of the journey and not the destination. Yes, the market is a little expensive based on historical numbers now, however I feel that earnings for the next few quarters will show that we are moving into a rally driven by earnings growth rather than monetary policy that we’ve had since 2009.
Remember the rule of 72 is a doubling every 10 years. If we get the Dow Jones Average over the next 10 years, then we will be celebrating Dow 40,000 on this day in 2027.

As always should you have any questions or concerns, please don’t hesitate to give us a call.

Any opinions are those of Mick Graham and not necessarily those of RJFS or Raymond James. Expressions of opinion are as of this date and are subject to change without notice. The S&P 500 is an unmanaged index of 500 widely held stocks that is generally considered representative of the U.S. stock market. Inclusion of these indexes is for illustrative purposes only. Keep in mind that individuals cannot invest directly in any index, and index performance does not include transaction costs or other fees, which will affect actual investment performance. Individual investor's results will vary. Past performance does not guarantee future results. Holding stocks for the long-term does not insure a profitable outcome. Investing in stocks always involves risk, including the possibility of losing one's entire investment. There is no guarantee that any statements, opinions or forecasts provided herein will prove to be correct. The information contained in this report does not purport to be a complete description of the securities, markets, or developments referred to in this material. The information has been obtained from sources considered to be reliable, but we do not guarantee that the foregoing material is accurate or complete.

