
Quarter 4 - 2023 Market Update
- 10.27.23
- Markets & Investing
- Article
We hope you are enjoying the cooler weather and many activities and events the fall brings.
Along with the changing season and weather, our office has also undergone a personnel change for the first time in over ten years. Merribeth, our long-time Client Services Manager retired in August and she and her husband, Luis have moved to the beach to enjoy their retirement. We are very grateful for her many years of service and will miss her, but we wish her the best in her retirement.
Market Update Summary:
The S&P 500 enjoyed gains, albeit mostly from a narrow group of stocks, during the first half of 2023. Volatility in the market took the summer off as it slowly trended higher until late July. The S&P 500 pulled back near 7% from the July highs during August and September. Since the average year experiences three to four pullbacks of at least 5% and 2023 had only seen one so far, the action the past few months was not surprising.
Expectations are that we are near or at the peak in interest rates, as The Federal Reserve (The Fed) is likely finished or almost finished raising interest rates. This has provided some relief to equity markets.
We believe we are closer to enjoying a period of ‘things getting better’, however, we don’t believe we are quite there yet. Although many across the media have discussed a more likely soft landing for the economy in recent months as it has held up, we do not believe we are out of the woods yet as far as interest rates, inflation, the economy, and a possible recession are concerned.
Market Update Key Points:
- S&P 500 performance mostly attributable to just seven companies (The Magnificent Seven).
- S&P 500 valuations: more nuanced than a headline.
- Seeking month-over-month Core CPI (Consumer Price Index) inflation readings lower than 0.3%.
- We are likely near peak interest rates.
- Fed tightening is impacting lending and will likely impact future spending.
- Soft landings are for planes, not economies.
- Short-term market consternation exacerbated by a rising 10-year treasury yield and strong U.S. dollar.
- History and experience are our guides as we prepare for opportunities ahead.
S&P 500 performance mostly attributable to just seven companies.
Much of the S&P 500’s gains this year came from a small number of stocks. 82% of the S&P 500’s returns though July 11th were made by just seven technology companies (Apple, Microsoft, NVIDIA, Amazon, Meta, Tesla and Google). These have been nicknamed “The Magnificent Seven”.
The S&P 500 is a cap-weighted index, meaning that the larger companies have a bigger impact on the performance of the index. At their peak The Magnificent Seven represented 29.6% of the S&P 500. The cap-weighted S&P 500 was up 14.19% year-to-date as of October 13th. The S&P 500 equal-weight index, with every stock in the index carrying the same weight, was up just 0.82% over the same period.
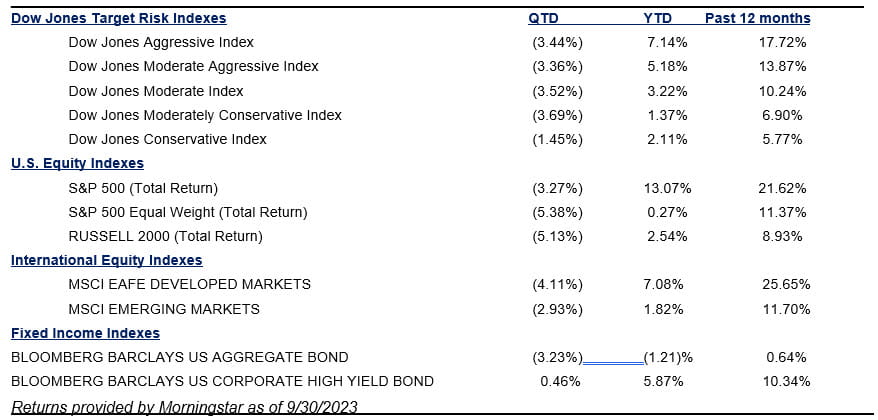
As you review the performance numbers below it is important to keep this in mind. Professional money managers have investing parameters to follow, and they all have a fiduciary responsibility to manage risk. This means only a tiny fractions of professional will have performance above the S&P 500 because they would not be allowed, nor is it fiduciarily sound, to run a portfolio of just seven technology stocks, unless one run a very concentrated technology fund.
S&P 500 valuations: more nuanced than a headline.
If you hear or read that the price to earnings (P/E) ratio of the S&P 500 is currently expensive, please understand there is more to that story than a headline would tell. Generally speaking, the lower the P/E the less expensive a stock or index. The higher the P/E the more expensive. The S&P 500 index, which is market-cap weighted, was trading near 16x forward expected earnings (P/E) near the October 2022 lows when it was trading around 3600. As of October 1st, at levels near 4277 The S&P 500 is trading near 21x forward expected earnings. The equal-weight S&P 500, is trading near 17x forward earnings estimates.
At any given time different sectors will be considered over-valued, under-valued or appropriately valued based on earnings of the companies and historical norms. Due to the significant gains by The Magnificent Seven compared with all the other stocks in the S&P 500 there is currently a significant valuation difference between those two groups of stocks. Investors have been willing to pay more for those seven stocks in part because of the excitement around artificial intelligence and the potential opportunities those stocks will have to participate in the future growth of artificial intelligence use. Only time will tell how much artificial intelligence opportunities will enhance the earnings growth of those and other companies.
If you remove The Magnificent Seven the other 493 S&P 500 stocks trade at a reasonable 15-16x forward earnings. At some point we expect outperformance from smaller and mid-sized companies as well as perhaps the equal-weight S&P 500 versus the cap-weighted S&P 500 as that occurs. Currently though, it appears high interest rates continue to pressure smaller companies that are more likely to rely in borrowing to fund their growth. We believe investing in smaller and mid-sized companies who do not need to issue new debt to finance growth will continue to be more prudent for now. Small and mid-cap stocks will likely benefit when The Fed does begin to lower rates, providing any recession we experience is shallow.
Seeking month-over-month Core CPI (consumer price index) inflation readings lower than 0.3%.
Many measures of inflation continue to decline, especially on the goods side. Used auto prices are down, so are clothing, some food and other items. You may notice more sales for many products than a year ago. Services remain elevated but are rising at a slower pace than they were months ago.
For inflation to gradually decline to The Fed’s 2% target we need to see several months in a row of sub .3% month-over-month Core CPI readings. We received good news July 12th when the Core CPI was expected to rise at 0.3%, but instead came in lower at 0.20%. August CPI came in at 0.3% and so did September. Readings below 0.30% will show a trend of declining inflation and help The Fed achieve their goal of pushing inflation back towards their 2% year-over-year target.
We are likely near peak interest rates.
The Fed knows the full impact of interest rate increases have not been absorbed into the economy, so they have slowed the rate of possible future increases, watching data between Fed meetings to determine whether they can hold rates here while inflation continues working its way down towards their 2% goal or whether they may need to increase rates a bit more (likely by 25 basis points (.25%)). Right now, expectations are for one more rate increase during 2023 and many believe that will be the last one. As for when The Fed might make the first rate cut that looks to be some months away. The Fed is concerned that if they declare they are finished raising rates inflation could spike up again and they would have to about-face and return to their rate-raising strategy. They appear to be preferring to sit tight, watch how data comes in to determine whether to raise any more or just leave rates at this level.
The Fed will also closely watch geo-political events and consider how what is occurring between Russia and Ukraine and unfortunately, now in Isreal and Gaza may impact the U.S. economy. They are more likely to pause on raising rates in light of escalating tensions.
Fed tightening is impacting lending and will likely impact future spending.
Interest rates were extremely low for many years prior to this recent period of Fed rate increases. Many consumers locked in these low rates for mortgages and car loans in the years before The Fed began raising rates. So, even though current rates are much higher, for many Americans there has not been a dramatic effect, especially those in higher income brackets. These folks have been hurt more by inflation than higher rates for the most part.
Those who do need a new home or car are finding it harder to obtain affordable financing. Banks have tightened lending standards, making loans harder to get and loans folks can get are now much more expensive.
Many businesses, especially larger companies, also took advantage of low-rate loans. The higher rates will impact future borrowing, and this is likely to slow some spending and hiring for some businesses in the future.
A Duke University quarterly CFO survey recently indicated that over 40% of CFOs said they are curtailing spending due to higher rates. Those with credit card debt are feeling the impact as the interest on their debt has increased substantially.
While the upper-end consumer remains in good shape, there are indications of stress for lower-end consumers. Student loan repayments have re-started, credit card delinquencies are up and auto sales are slowing. The longer rates remain high, the more the consumers’ ability to spend, will be suppressed.
Soft landings are for planes, not economies.
There has been a lot of talk about whether The Fed can guide the U.S. economy to a soft-landing rather than into a recession. The term land implies an end. Economies do not end. They are dynamic and ever-changing. At the beginning of 2023 most forecasts we read were for the U.S. economy to enter recession during the third or fourth quarter of this year. Economic forecasts are challenging because there are many inputs that effect the economy, some of which are difficult if not impossible to predict. Add the irregularity of emerging from a global pandemic that dislocated so many parts of the world-wide economy and forecasting if or when we might end up in a recession due to a steep increase in interest rates and it’s been tough for even the smartest, most experienced minds to figure out if and when a recession will happen. Also of note is that we won’t know when a recession began until after the fact, so it is still quite possible the U.S. economy could enter a recession during the fourth quarter of this year, but it would not necessarily be declared until next year after experiencing two consecutive negative quarters of GDP.
As the economy continued to grow during the second and third quarters more pundits came out declaring we would likely avoid recession and The Fed looked like they may achieve the ever-sought-after soft-landing.
We are still somewhat skeptical that we will completely avoid a recession. As noted by Deutsche Bank strategist Jim Reid in the Yahoo Finance article “What 70 years of data reveals about the Federal Reserve causing recessions” “not every Fed hiking cycle leads to a recession, but all hiking cycles that invert the curve have led to recessions within 1 to 3 years”. The yield curve’s most recent inversion occurred in October 2022 as the 3-month Treasury yield rose above the 10-year Treasury note.
Dr. David Kelly Chief Global Strategist and Head of the Global Market Insight Strategy Team for JP Morgan recently opined on a call that it is one thing for The Fed to hit the landing but holding it for 6-12 months is another thing.
This cycle has seen rates rise over 5% in just a year and a half. Our view remains balanced. We acknowledge everything has been atypical over the past three and a half years and with a consumer who is still spending and low unemployment maybe, just maybe this will be one of those rare times when The Fed can hike rates significantly without putting the U.S. economy into recession. All things considered, we acknowledge that the history of past rate-hiking cycles, especially at the clip this one has occurred, leans on the side of eventually landing the U.S. into a recession and think caution is warranted.
Short-term market consternation exacerbated by a rising 10-year treasury yield and strong U.S. dollar.
The yield on the benchmark 10-year treasury is up 70 basis points this year and the continued rise has market participants concerned about just how high it will go. There are numerous reasons that appear to be contributing to the rise. Just a few include:
- The Fed has been engaged in quantitative tightening (QT), shrinking its balance sheet by around $100 billion each month. This is to unwind the quantitative easing (QE) it engaged in to support markets through the pandemic. This is draining liquidity and helping push rates higher.
- Several countries around the world are reducing their holdings of U.S. dollars as a reserve currency. They are trying to reduce their reliance on the U.S. dollar in international trade and finance. The sale of U.S. Treasuries by the central banks of these countries puts upward pressure on rates.
- The U.S. federal government has engaged in massive stimulus, running a budget deficit of about 6.3% of GDP, according to Why Rates are Rising from Advisor Perspectives, written on 10/2/23. The fiscal deficit, which is forecasted to continue rising, led to the downgrading of our debt rating, which may cause foreign investors to demand a higher risk premium to hold our debt. Additionally, because of the deficit the U.S. must issue and sell more Treasury bonds to fund the debt.
The U.S. dollar has risen dramatically relative to the currencies of our major trading partners in recent months. Among the reasons why are:
- A primary reason for the dollar’s rally is the upward shift in expectations about the path of U.S. interest rates.
- The dollar has also benefitted from foreign direct investment in manufacturing facilities as companies have shifted production to the U.S. market after experiencing supply disruptions due to the pandemic and due to trade disputes.
- Weakness in other countries’ economies and currencies, especially the Japanese and Chinese.
A strong U.S. dollar can cause consternation in the stock market because it makes investing in the U.S. more expensive for holders of other currencies. It also can hurt the earnings of U.S. based companies who earn large amounts of revenue outside the U.S. When the dollar rises against another currency, like the Euro, a companies’ sales in Europe will be worth less once they are exchanged back into dollars.
Many days when the dollar and yields are rising stocks have struggled. When yields and the dollar ease back it provides relief to the stock market. We will continue watching this dynamic.
History and experience are our guides as we prepare for opportunities ahead.
Even as we still believe it is likely we will enter a recession at some point, we still believe it will be on the mild side and see a lot of opportunity as investors begin looking beyond that point.
Over the past few quarters, we shared some statistics that boded well for S&P 500 returns this year and going forward. While they offer no guarantees, we remind you of these that have so far been pretty accurate:
Historical data pointed to positive returns post mid-term elections that were held November 2022:
According to Larry Adam, since the data has been tracked the S&P 500 has been positive:
- 95% of the time six months following mid-term elections, up an average of 13%. (in the six months following the November 8, 2022 election the S&P 500 was up 9.8% through May 5th)
- 100% of the time 12-months later by an average of near 14%.
- 95% of the time 24-months later by an average of near 25%.
Positive follow through when the first five days of January are positive:
January 11, 2023 Mike Gibbs, Head of Gibbs Capital Management noted on a call that when the first five days of January are positive the remainder of the year is up 83% of the time by an average of 14%. The positivity is even stronger when the month of January finishes with a positive return, which it did.
We also have seasonality on our side for the rest of the year, as the period from mid-October through year-end is traditionally a strong one for stocks.
Rising tensions across the world after the attack by Hamas on Israel are a concern but unless the war expands into more than a regional conflict the markets have taken it in stride. We pray for all the people in the region and pray that somehow there will be a de-escalation to a difficult situation. We can’t predict as to what will occur, but we do know the market has learned to get past many troubling events across the world over time.
The chart below shows the long-term resiliency of the U.S. stock market through many wars and other crisis.
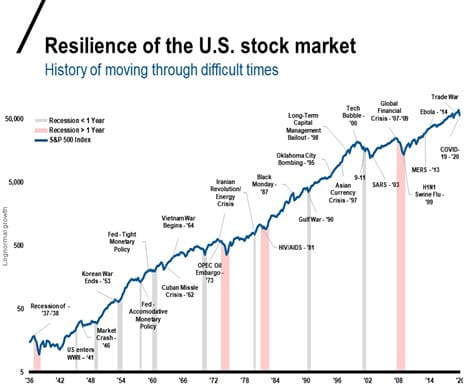
The U.S. and global economy have endured many challenging situations over the life of markets. In every circumstance the S&P 500 has gone on to eventually make new highs, as this chart above shows. We continue working hard to guide you through these uncertain times and towards your long-term goals. We will e-mail you invitations to informative webinars as they are announced. Please also check our website and social media pages regularly for timely updates on all these topics.
Facebook: https://www.facebook.com/hfgraymondjames
LinkedIn:
Eric Hilliard, CFP®, Branch Manager https://www.linkedin.com/in/ewhilliard/
Wade Stafford, CFP®, Associate Financial Advisor https://www.linkedin.com/in/ericwstafford/
Jenny Hilliard, Investment Executive: https://www.linkedin.com/in/jennyhilliardrj/
Please let us know of any significant changes in your life or situation that could impact your financial plan. In the meantime, we continue to follow the processes we have developed over the years that enable us to provide you our very best.
Thank you for your trust in me and in our practice.
Sincerely,
Eric W. Hilliard
CERTIFIED FINANCIAL PLANNER™
Branch Manager
Trusted advisors, helping our clients invest, preserve, and distribute wealth since 1973.
The information contained in this report does not purport to be a complete description of the securities, markets, or developments referred to in this material.
The foregoing information has been obtained from sources considered to be reliable, but we do not guarantee that it is accurate or complete, it is not a statement of all available data necessary for making an investment decision and it does not constitute a recommendation.
To opt out of receiving future emails from us, please reply to this email with the word “Unsubscribe” in the subject line. The information contained within this commercial email has been obtained from sources considered reliable, but we do not guarantee the foregoing material is accurate or complete.
Investing involves risk, and investors may incur a profit or a loss regardless of strategy. All expressions of opinion are subject to change. Past performance is not an indication of future results and there is no assurance that any of the forecasts, statements, or opinions mentioned will occur.
DJ GLB Aggressive Index - The DJ GLB Aggressive is a total-portfolio index that allow investors to evaluate the returns on their portfolios considering the amount of risk they have taken. These profiles are defined based on incremental levels of potential risk relative to the risk of an all-stock index. It's made up of composite indices representing the three major asset classes: stocks, bonds and cash. The asset class indices are weighted differently within each relative risk index to achieve the targeted risk level. The weightings are rebalanced monthly to maintain these levels. The DJ GLB Aggressive index is 100% of All Stock Portfolio Risk.
DJ GLB Conservative Index - The DJ GLB Conservative is a total-portfolio index that allow investors to evaluate the returns on their portfolios considering the amount of risk they have taken. These profiles are defined based on incremental levels of potential risk relative to the risk of an all-stock index. It's made up of composite indices representing the three major asset classes: stocks, bonds and cash. The asset class indices are weighted differently within each relative risk index to achieve the targeted risk level. The weightings are rebalanced monthly to maintain these levels. The DJ GLB Conservative index is 20% of All Stock Portfolio Risk.
DJ GLB Moderate Aggressive Index - The DJ GLB Moderate Aggressive is a total-portfolio index that allow investors to evaluate the returns on their portfolios considering the amount of risk they have taken. These profiles are defined based on incremental levels of potential risk relative to the risk of an all-stock index. It's made up of composite indices representing the three major asset classes: stocks, bonds and cash. The asset class indices are weighted differently within each relative risk index to achieve the targeted risk level. The weightings are rebalanced monthly to maintain these levels. The DJ GLB Moderate Aggressive index is 80% of All Stock Portfolio Risk.
DJ GLB Moderate Conservative Index - The DJ GLB Moderate Conservative is a total-portfolio index that allow investors to evaluate the returns on their portfolios considering the amount of risk they have taken. These profiles are defined based on incremental levels of potential risk relative to the risk of an all-stock index. It's made up of composite indices representing the three major asset classes: stocks, bonds and cash. The asset class indices are weighted differently within each relative risk index to achieve the targeted risk level. The weightings are rebalanced monthly to maintain these levels. The DJ GLB Moderate Conservative index is 40% of All Stock Portfolio Risk.
DJ GLB Moderate Index - The DJ GLB Moderate is a total-portfolio index that allow investors to evaluate the returns on their portfolios considering the amount of risk they have taken. These profiles are defined based on incremental levels of potential risk relative to the risk of an all-stock index. It's made up of composite indices representing the three major asset classes: stocks, bonds and cash. The asset class indices are weighted differently within each relative risk index to achieve the targeted risk level. The weightings are rebalanced monthly to maintain these levels. The DJ GLB Moderate index is 60% of All Stock Portfolio Risk.
The Dow Jones Industrial Average is an unmanaged index of 30 widely held stocks. The S&P 500 is an unmanaged index of 500 widely held stocks. The S&P 500 Equal Weight Index (EWI) is the equal-weighted version of the widely used S&P 500. The index includes the same constituents as the capitalization weighted S*P 500, but each company in the S&P 500 WEI is allocated a fixed weight – or 0.2% of the index total at each quarterly rebalance. Keep in mind the individuals cannot invest directly in any index, and index performance does not include transaction costs or other fees, which will affect actual investment performance. Individual investor’s results will vary. The MSCI EAFE (Europe, Australia, Far East) index is an unmanaged index that is generally considered representative of the international stock market. MSCI Emerging Markets Index is designed to measure equity market performance in 24 emerging market countries. The index’s three largest industries are materials, energy and banks. The Russell 2000 is an unmanaged index of small cap securities. The Bloomberg Barclays US Aggregate Bond Index is a broad-based flagship benchmark that measures the investment grade, U.S. dollar-denominated, fixed-rate taxable bond market. The Bloomberg Barclays U.S. Corporate High Yield Bond Index is composed of fixed-rate, publicly issued, non-investment grade debt, is unmanaged, with dividends reinvested and is not available for purchase. The index includes both corporate and non-corporate sectors. The corporate sectors are Industrial, Utility and Finance which include both U.S. and non-U.S. corporations. An investment cannot be made in these indexes. Index performance does not include transaction costs or other fees, which will affect actual investment performance. Individual investor’s results will vary. International investing involves additional risks such as currency fluctuations, differing financial accounting standards, and possible political and economic instability. These risks are greater in emerging markets. The performance noted does not include fees or charges, which would reduce an investor's returns. Asset allocation and diversification do not guarantee a profit nor protect against a loss. Any Opinions are those of Eric and Jenny Hilliard and are not necessarily those of RJFS or Raymond James Investing in small and mid-cap stocks generally involves greater risks, and therefore, may not be appropriate for every investor. The prices of small and mid-company stocks may be subject to more volatility than those of large company stocks.
Securities offered through Raymond James Financial Services, Inc., member FINRA/SIPC. © 2018 Raymond James Financial Services, Inc., member FINRA/SIPC. Investment Advisory Services offered through Raymond James Financial Services Advisors, Inc.
Raymond James Financial Services does not accept orders and/or instructions regarding your account by email, voice mail, fax or any alternate method. Transactional details do not supersede normal trade confirmations or statements. Email sent through the Internet is not secure or confidential. Raymond James Financial Services reserves the right to monitor all email. Any information provided in this email has been prepared from sources believed to be reliable, but is not guaranteed by Raymond James Financial Services and is not a complete summary or statement of all available data necessary for making an investment decision. Any information provided is for informational purposes only and does not constitute a recommendation. Raymond James Financial Services and its employees may own options, rights or warrants to purchase any of the securities mentioned in this email. This email is intended only for the person or entity to which it is addressed and may contain confidential and/or privileged material. Any review, retransmission, dissemination or other use of, or taking of any action in reliance upon, this information by persons or entities other than the intended recipient is prohibited. If you received this message in error, please contact the sender immediately and delete the material from your computer.
