
Quarter 2 2023 Market Update
- 05.23.23
- Markets & Investing
- Article
We hope you have been well the first few months of the year. The first quarter of 2023 is in the books and we are in the midst of earnings season to begin the second quarter. This Market Update is coming to you a bit later in the quarter than usual. We just returned from our Raymond James National Conference and knew we would come away with information worthy or sharing. We certainly did and hope this insight serves you well.
Market Update Summary:
The S&P 500 bottomed last October around 3577. It gained during the last few months of the quarter and the first month or so of 2023, even as high levels of pessimism around The Fed engineering a soft-landing remained. It was a good example of markets climbing a wall of worry. Then came a new thing to worry about when Silicon Valley Bank and Signature Bank failed, bringing fears problems with other banks could be lurking in the shadows.
Overall, the index has traded in a range between roughly 3800 and 4200. On declines, the lows have been higher, a positive development. However, a small group of large, mostly technology, companies have been driving most of the gains recently and we would like to see more stocks participating on the upside.
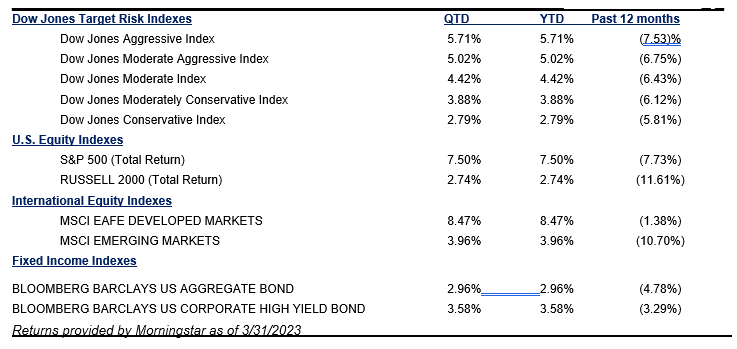
Here are Key points we will cover, and we invite you to review the performance numbers.
Key Points we will cover in this Market Update:
- The economy is beginning to feel the impact of rate hikes that started March 2022
- Preparing for the most telegraphed recession ever
- Inflation is declining, but will take time to get down to the Federal Reserve’s 2% target
- Rapid pace of interest rates hikes creates challenges for banks
- Market focus moving from interest rake hikes to fundamentals of the economy
- Current concerns
- Perspective helps as we ride through the volatility
- Keeping our focus on the opportunities in the months and years ahead
The economy is beginning to feel the impact of interest rate hikes that started March 2022
The Federal Reserve (The Fed) raised rates at a historically fast pace throughout 2022. For the past year we have written that it takes several months, even up to 18 months for the impact of higher rates to flow through to the economy. Lenders often adjust their variable-rate loans within one to two months after a Fed rate hike, so it is a trickle=down effect and can take a while for the consumer to feel the pinch from higher borrowing rates. It has now been over 12 months since the Fed began raising rates and the past few months the economy has begun showing signs of slowing down. Areas such as manufacturing and retail sales, are weakening on annual and month-over-month basis while consumer revolving credit is increasing.
Employment numbers, which are a lagging indicator, are still strong, with unemployment only at 3.4%, but showing early signs of weakening. Hours worked and temporary job openings have declined. Many layoffs have been announced and already occurred, so we should expect weaker numbers going forward. A difference in this cycle from most is that most of the job losses are coming from higher wage earners, not lower wage earners. Some companies, particularly in technology and consumer goods sectors over-hired during the pandemic when we were all consuming technology and goods from home, while many service businesses are still trying to build up to being fully staffed after shortages they have experienced since the pandemic.
Preparing for the most telegraphed recession ever
First quarter Gross Domestic Product (GDP) grew at a rate of 1.1% and that is expected to be the high mark for the year. Most market experts and economists we heard from at the Raymond James National Conference expect the economy to enter recession during the third or fourth quarter. They also expect the recession to be mild for a few reasons:
- The consumer entered this period well off due to all the stimulus handed out by the federal government over the past few years and due to the strong job market.
- The fact we have been anticipating this recession for so long has given consumers and especially businesses time to prepare.
- Consumer debt is rising, however after years of sub 4% rates for mortgages and car loans, fixed income debt servicing is low for most. Businesses have also benefited from low rates, but some will have loans coming due and they will be forced to re-issue new debt at higher rates which could increase their economic stress.
Unlike this potential recession which has been anticipated for over a year, many recessions are brought about by situations black swan events that catch us by surprise (i.e. tech bubble, 9-11 terrorist attacks, housing crisis, COVID pandemic). At this point the greater surprise will be if we are somehow able to avoid a recession, ending up with the hoped-for soft-landing.
Inflation is declining, but will take time to get down to the Fed’s target of 2%
Phil Orlando, Chief Equity Strategist of Federated Hermes and frequent CNBC and Fox Business guest, discussed that going back to 1974 every time The Fed raises rates, the top Fed Funds rate has always ended up being slightly higher than inflation at that point in time. Well, rates are now right about where the last inflation reading came in, so that is additional evidence that the rate hiking cycle should be at or near its end.
Orlando also shared his belief that while Inflation has declined from a peak of 9.1% June 2022 down to 5% currently, that was mostly the froth and it will be tougher and likely take time to get it from 5% to 2%. That means the Fed is likely to keep rates higher for several months before beginning to cut rates. That is, unless something breaks, which brings us to the banks.
Rapid pace of interest rates hikes creates challenges for banks
The fastest pace of interest rate increases experiences since 1980 has impacted many areas of the economy. Banks have been impacted significantly. Important points we want to convey on the situation:
- Banks bought safe U.S. Treasury bonds at below 1% yields over the past several years with cash on the books. They made loans to customers at 1%-2% higher rates. Some banks wanted to get higher yields for their customers, so they invested in longer-term bonds which paid higher rates. When rates raised quickly towards 5% that left many banks with longer-term bonds at a loss because when yields go up the value of current bonds that pay lower yields fall. If the banks held those bonds to maturity they get their principal back, collected their small yield along the way and all is fine. However, if they were forced to sell those bonds to meet deposit withdrawals by their customers they would have to sell at a significant loss. This is essentially what happened to Silicon Valley Bank. Some folks became concerned the bank might be in trouble. Technology executives and employees who were the majority of the bank’s customers used social media to quickly spread the word and a run on the bank quickly ensued, ensuring the bank’s failure.
- Silicon Valley Bank and Signature Bank out of New York both had significant parts of their business concentrated in risky areas. Silicon Valley Bank took a lot of risk investing in technology start-up companies, which struggled last year. Signature Bank had a lot of exposure to Coinbase. That, along with poor management of the bond portfolio as interest rates rose contributed to their failures. Silicon Valley Bank, who’s FDIC (Federal Deposit Insurance Corp) insured accounts stood at only 4% of all deposits, troubles were exacerbated when the very people they serve, technology professionals, used social media to very quickly spread the word the bank was at risk.
- A few smaller regional banks fail every year, especially during periods of recession, so the fact that a few banks are stressed and some may fail is not unusual.
Fed Chairman Jerome Powell has several times reassured that the banking system is in good shape. We are told that The Treasury, Federal Reserve, FDIC and other regulators in Washington are monitoring the situation and working on solutions to deal with any bank issues that do arise. So far, they have mitigated the impact of bank failures on bank customers. We have also heard from numerous financial industry professionals we follow that the banking industry is currently well-capitalized and should be able to weather the difficult environment, especially large banks, which have well-diversified businesses. The banking system is not dealing with a credit crisis as it was during 2008-2009 due to the housing crisis. However, higher rates do present some challenges to their profitability, so their earnings and stock prices may underperform for a period. Longer term, after significant declines experienced the past two months, the prices at which many financials are currently trading may look in retrospect like good buying opportunities. How long it takes them to recover however, is unknowable.
Market focus moving from interest rate hikes to fundamentals of the economy
Primary focus of investors the past several months has been on the pace of rate hikes by the Federal Reserve and trying to determine when they might be finished or near finished raising rates. We believe we are near the end of the rate hike cycle and now sense that the market is beginning to shift focus on economic data as it comes in. Each data point signals clues as to how the economy is doing after absorbing higher interest rates.
If economic data and corporate earnings can hang in there with mild to modest weakening and inflation continues coming down the market will begin to cheer. Markets will likely make significant gains before things really feel better, based on historical precedent.
Currently concerns
Short-medium term concern:
Our base case expectation is that the economy will enter recession during the second half of this year and that it will likely be mild. Markets are currently pricing in rate cuts by year-end. However, The Fed has only committed to being more data dependent and currently Powell is saying he does not anticipate cutting rates this year. In coming months if inflation remains elevated and it appears less likely The Fed will be able to start reducing rates investors may become anxious and market volatility could increase.
Short-medium concern:
If more banks experience stress because of high interest rates this would certainly weigh on markets. The Fed keeps assuring us our banking system is sound and has made moves to stabilize it. As mentioned previously, others we follow agree with them thus far. Hopefully they are right. Officials are paying attention and making decisions about how to deal with minor stresses, should they occur. There is no reason at this time to believe any issues would approach the seriousness of what the financial system dealt with during the 2008-2009 housing crisis, so any challenges should be shorter-term in nature.
One additional concern as it relates to banks is that they are likely to be more cautious about lending as they batten down the hatches to get through these circumstances. Less availability of credit could especially hurt smaller businesses, and that could lead to business failures and loss of jobs. This would have the potential to make a recession deeper than currently expected. If evidence of this stress on the economy were to occur, The Fed would likely begin lowering rates quickly. Which would be supportive of the economy and stocks. In this scenario the economy would likely already be in recession by the time The Fed moves to lower rates.
Short-term concern:
We also expect rhetoric around the debt ceiling debate to heat up sometime around June/July, but maybe even sooner. It has to be raised. It always ends up being raised, but there may be a contentious fight as certain politicians demand spending cuts or some action on entitlement spending. They have a reason to be concerned as our debt has skyrocketed in the past few years. The ratio of total federal debt to GDP is now 123%, the highest of all time. As interest rates have risen this increases the interest expense of the federal government. High levels of debt and spending on the interest rates associated with that debt will result in a slower economy in the years ahead. So, reducing the debt and eventually getting back to lower interest rates would both help. The point is there are many in Congress who are very concerned and will demand some concessions by the White House. Again, this will be a short-term issue because they have to and will raise the debt ceiling just like the 78 previous times, but this could easily trigger a market pullback as our politicians negotiate the terms.
Perspective helps as we ride through the volatility
The S&P 500 was trading at 3380 February of 2020, just before the pandemic became front and center. The market made a high of 4766 December 26, 2021. Much of that significant gain was due to cash investors had from massive stimulus the government handed out during COVID, The Fed maintaining zero interest rates providing free money to all who could access it and folks simply not having much to do. There was a lot of money chasing stocks and with extremely low interest rates bonds were paying they were not completive.
Even with the declines we have experienced since December 2021, taking the high end of the recent range around 4180, the S&P 500 is still trading about 24% above pre-pandemic levels.
Drawing trendlines on a chart of the S&P 500 going back to 2009, one connecting the gradually increasing highs and another connecting lows shows that if the pandemic never occurred and the market continued trading in the range it was, it would likely be trading somewhere between 3300 on the low side and 4000 on the high side. The market declined to beneath the bottom of the trendline during March 2020 when the economy came to a stop because of COVID-19 lockdowns. It began rising the second half of March and climbed above that range in November 2020, continued higher until December 2021 and began declining January 2022 when it became apparent inflation was a problem and The Fed was going to have to begin raising rates. The past six months or so the index has traded near the top of the trendline. Since the trendlines are rising the top and bottom numbers continue to rise as the months move forward.
Keeping our focus on the opportunities in the months and years ahead
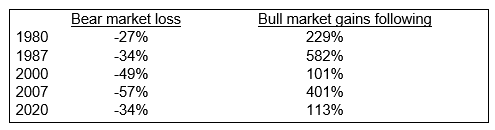
Bull markets are built on the shoulder of bear markets. Tavis McCourt, CFA, with Institutional Equity Research at Raymond James shared a chart recently that showed the bull markets that followed bear markets going back to 1956. Since 1980 here are the bear markets that have occurred and the bull markets that followed:
We shared in the last Market Update that historical data points to positive returns post mid-term elections: According to Larry Adam, since the data has been tracked the S&P 500 has been positive:
- 95% of the time six months following mid-term elections, up an average of 13%. (in the six months following the most recent election, November 8th the S&P 500 is up 9.8% through May 5th)
- 100% of the time 12-months later by an average of near 14%.
- 95% of the time 24-months later by an average of near 25%.
Hopefully the rest of the historical data comes to fruition.
Positive follow through when the first five days of January are positive:
When the first five days of January are positive the remainder of the year is up 83% of the time by an average of 14%. The positivity is even stronger when the month of January finishes with a positive return, which it did.
The recovery can’t be timed because stocks usually recover quickly and strongly off bear market lows
- Stocks are often up substantially within 60-days of bear market lows (+22% in recessionary bear markets and 17% in non-recessionary bear markets).
- The news is often still very negative within 60-day of bear market lows, so it does not wait to pay for skies to clear before trying to get back into the market, for those trying to time the market.
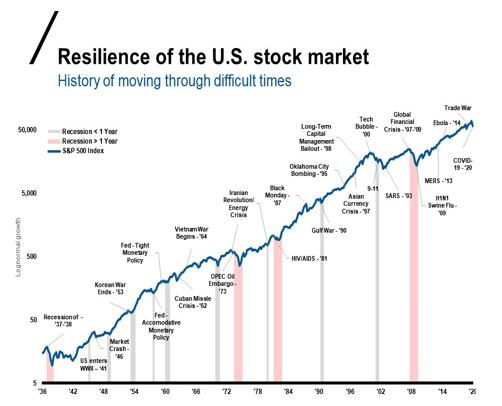
The U.S. and global economy have endured many challenging situations over the life of markets. In every circumstance the S&P 500 has gone on to eventually make new highs, as this chart above shows. Every day we grow closer to the next bull market. We are working hard for you in our effort to guide you through this time and towards your long-term goals. We will e-mail you invitations to informative webinars as they are announced. Please also check our website and social media pages regularly for timely updates on all these topics.
Facebook: https://www.facebook.com/hfgraymondjames
LinkedIn:
Eric Hilliard, CFP®, Branch Manager – https://www.linkedin.com/in/ewhilliard/
Wade Stafford, CFP®, Associate Financial Advisor – https://www.linkedin.com/in/ericwstafford/
Jenny Hilliard, Investment Executive – https://www.linkedin.com/in/jennyhilliardrj/
Please let us know of any significant changes in your life or situation that could impact your financial plan. In the meantime, we continue to follow the processes we have developed over the years that enable us to provide you our very best.
Thank you for your trust in me and in our practice.
The information contained in this report does not purport to be a complete description of the securities, markets, or developments referred to in this material.
The foregoing information has been obtained from sources considered to be reliable, but we do ot guarantee that it is accurate or complete, it is not a statement of all available data necessary for making an investment decision and it does not constitute a recommendation.
To opt out of receiving future emails from us, please reply to this email with the word “Unsubscribe” in the subject line. The information contained within this commercial email has been obtained from sources considered reliable, but we do not guarantee the foregoing material is accurate or complete. The information has been obtained from sources considered to be reliable, but we do not guarantee that the foregoing material is accurate or complete.
Investing involves risk, and investors may incur a profit or a loss regardless of strategy. All expressions of opinion are subject to change. Past performance is not an indication of future results and there is no assurance that any of the forecasts, statements, or opinions mentioned will occur.
DJ GLB Aggressive Index - The DJ GLB Aggressive is a total-portfolio index that allow investors to evaluate the returns on their portfolios considering the amount of risk they have taken. These profiles are defined based on incremental levels of potential risk relative to the risk of an all-stock index. It's made up of composite indices representing the three major asset classes: stocks, bonds and cash. The asset class indices are weighted differently within each relative risk index to achieve the targeted risk level. The weightings are rebalanced monthly to maintain these levels. The DJ GLB Aggressive index is 100% of All Stock Portfolio Risk.
DJ GLB Conservative Index - The DJ GLB Conservative is a total-portfolio index that allow investors to evaluate the returns on their portfolios considering the amount of risk they have taken. These profiles are defined based on incremental levels of potential risk relative to the risk of an all-stock index. It's made up of composite indices representing the three major asset classes: stocks, bonds and cash. The asset class indices are weighted differently within each relative risk index to achieve the targeted risk level. The weightings are rebalanced monthly to maintain these levels. The DJ GLB Conservative index is 20% of All Stock Portfolio Risk.
DJ GLB Moderate Aggressive Index - The DJ GLB Moderate Aggressive is a total-portfolio index that allow investors to evaluate the returns on their portfolios considering the amount of risk they have taken. These profiles are defined based on incremental levels of potential risk relative to the risk of an all-stock index. It's made up of composite indices representing the three major asset classes: stocks, bonds and cash. The asset class indices are weighted differently within each relative risk index to achieve the targeted risk level. The weightings are rebalanced monthly to maintain these levels. The DJ GLB Moderate Aggressive index is 80% of All Stock Portfolio Risk.
DJ GLB Moderate Conservative Index - The DJ GLB Moderate Conservative is a total-portfolio index that allow investors to evaluate the returns on their portfolios considering the amount of risk they have taken. These profiles are defined based on incremental levels of potential risk relative to the risk of an all-stock index. It's made up of composite indices representing the three major asset classes: stocks, bonds and cash. The asset class indices are weighted differently within each relative risk index to achieve the targeted risk level. The weightings are rebalanced monthly to maintain these levels. The DJ GLB Moderate Conservative index is 40% of All Stock Portfolio Risk.
DJ GLB Moderate Index - The DJ GLB Moderate is a total-portfolio index that allow investors to evaluate the returns on their portfolios considering the amount of risk they have taken. These profiles are defined based on incremental levels of potential risk relative to the risk of an all-stock index. It's made up of composite indices representing the three major asset classes: stocks, bonds and cash. The asset class indices are weighted differently within each relative risk index to achieve the targeted risk level. The weightings are rebalanced monthly to maintain these levels. The DJ GLB Moderate index is 60% of All Stock Portfolio Risk.
The Dow Jones Industrial Average is an unmanaged index of 30 widely held stocks. The S&P 500 is an unmanaged index of 500 widely held stocks. The MSCI EAFE (Europe, Australia, Far East) index is an unmanaged index that is generally considered representative of the international stock market. MSCI Emerging Markets Index is designed to measure equity market performance in 23 emerging market countries. The index’s three largest industries are materials, energy and banks. The Russell 2000 is an unmanaged index of small cap securities. The Bloomberg Barclays US Aggregate Bond Index is a broad-based flagship benchmark that measures the investment grade, U.S. dollar-denominated, fixed-rate taxable bond market. The Bloomberg Barclays U.S. Corporate High Yield Bond Index is composed of fixed-rate, publicly issued, non-investment grade debt, is unmanaged, with dividends reinvested and is not available for purchase. The index includes both corporate and non-corporate sectors. The corporate sectors are Industrial, Utility and Finance which include both U.S. and non-U.S. corporations. An investment cannot be made in these indexes. Index performance does not include transaction costs or other fees, which will affect actual investment performance. Individual investor’s results will vary. International investing involves additional risks such as currency fluctuations, differing financial accounting standards, and possible political and economic instability. These risks are greater in emerging markets. The performance noted does not include fees or charges, which would reduce an investor's returns. Asset allocation and diversification do not guarantee a profit nor protect against a loss. Any Opinions are those of Eric and Jenny Hilliard and are not necessarily those of RJFS or Raymond James
