
The Week in Review 02/05/2024
"No pressure, no diamonds.” – Thomas Carlyle
Last week was another dynamic week as we digested earnings reports, most of which impressed. The S&P 500 and the Dow saw new highs, the Russell 2000 was the exception.
Small Caps were another story… the underperformance of the small cap index was related to weakness in regional bank stocks after New York Community Bank reported that its provision for credit losses in the fourth quarter totaled $552 million compared to a $62 million provision for the three months ended September 30, 2023.
The increase, it said, was primarily attributable to higher net charge-offs, as well as, to address weakness in the office sector, potential repricing risk in the multi-family portfolio, and an increase in classified assets.
The added thunder came in the company's declaration that it would be cutting its dividend by 70% to $0.05 per common share to build capital. This report reminded investors of the regional bank fallout from last year.
Meanwhile, mega cap stocks outperformed the broader market as a group following earnings results from some influential names.
Alphabet and Microsoft reported results on Tuesday. The former logged a 6.7% decline last week while the latter climbed 1.8%. Apple, Amazon.com, and Meta Platforms all reported earnings on Thursday. Apple declined 3.4% on the week, while Amazon.com jumped 8.0% and META gained 20.5%.
These names combined make up nearly a quarter of the S&P 500.
Dow component Boeing was another notable name that reported earnings last week, logged a 1.9% gain since last Friday. BA is still down nearly 20% this year, however, following the prior grounding of 737 Max 9 planes.
In addition to earnings from influential names, this week's price action was driven by a recalibration of rate cut expectations following more strong economic data and the FOMC decision on Wednesday. The committee voted unanimously to leave the target range for the fed funds rate unchanged at 5.25-5.50%.
This move was expected, but the market was hoping for a more dovish shift in rhetoric around the Fed's rate cut path. Instead, the directive declared that "The Committee does not expect it will be appropriate to reduce the target range until it has gained greater confidence that inflation is moving sustainably toward 2 percent."
Fed Chair Powell reiterated this view in his subsequent press conference. Mr. Powell spoke specifically about the possibility of a March rate cut, saying in part "I don't think it is likely that the Committee will reach a level of confidence by the time of the March meeting to identify March at as the time to do that (cut rates), but that is to be seen."
Just about everything sold off on Wednesday in response.
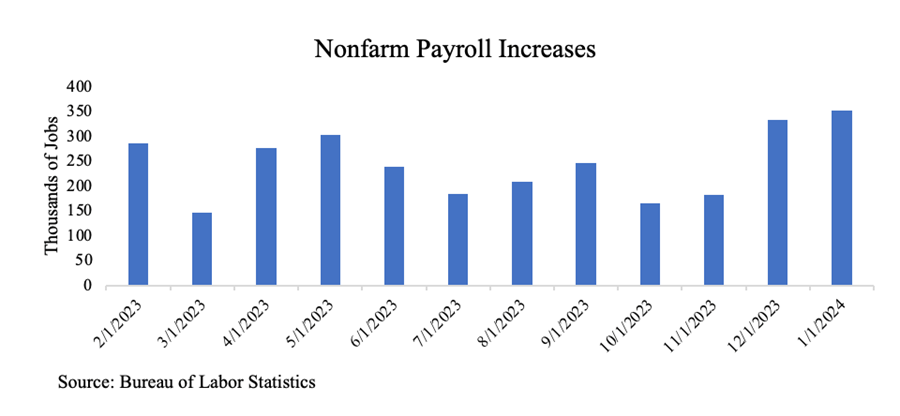
The FOMC decision was followed by a much stronger than expected January Employment Situation Report on Friday, which featured a big upside surprise in payroll growth that was accompanied by a larger than expected increase in average hourly earnings.
As a result, the fed funds futures market repriced the probability of a 25-basis points rate cut at the March FOMC meeting to 20.5% (from 38.0% on Thursday and 47.6% one week ago) while the probability of a 25-basis points rate cut at the May FOMC meeting has been reduced to 74% (from 93.8% Thursday), according to the CME FedWatch Tool.
The price action in the Treasury market was partially in response to the rate cut rethink, and with the Treasury Department's first quarter borrowing estimate. The Treasury Department plans to borrow $760 billion in Q1, which is $55 billion below the forecast from October due to higher net fiscal flows and a higher cash balance at the beginning of the quarter. Borrowing in Q2 is expected to reach $202 billion.
The 2-yr note yield declined two basis points to 4.38% and the 10-yr note yield fell 13 basis points to 4.03%.
January’s jobs report posted the largest monthly gain since January of 2023, reinforcing the labor market’s status as a bedrock of the economy.
The jobs market remains one of the economy’s main engines with the unemployment rate near a 50-year low. November and December’s reports were also revised up 9,000 and 117,000, respectively. Additionally, wage growth increased 0.6% for the month and 4.5% year-over-year, while the unemployment rate held steady at 3.7% for the third straight month.
Powell said that while inflation has come down in the past six months (with the core rate excluding energy and foods of the metric he most closely watches) to the Fed’s 2% target, he and the other members of its monetary policy committee want to see a little more confirmation of the trend.
Market Snapshot…
- Oil Prices – Oil prices dropped by nearly 2% on odds interest rate cuts would not occur. West Texas Intermediate crude futures (WTI) fell $1.54 or 2%, to close at $72.28 a barrel. Brent crude futures shed $1.37, or 1.07%, to close at $77.33 a barrel.
- Gold– Gold prices slipped following a strong jobs report. Spot Gold was down 0.8% to $2,038.59 per ounce while U.S. gold futures fell 0.7% to $2,0557.10. Silver closed out the week at $21.984.
- U.S. Dollar– The dollar index jumped to a seven-week high in a broad rally. The dollar index reached 104.4, the highest it’s been since Dec. 12. Euro/US$ exchange rate is 1.074.
- U.S. Treasury Rates– The yield on the 10-year Treasury note topped 4% after a strong jobs report, an increase of 16 basis points.
- Asian shares were mixed in overnight trading.
- European markets are trading higher.
- Domestic markets are trading in the red this morning.
This week will be relatively light on the economic front. We will receive ISM non-manufacturing data and hear from several more FOMC members throughout the week. As such, a lot of focus will go toward the broad indices.
The Nasdaq is looking to reach a new all-time high and the S&P 500 is close to surpassing 5,000 for the first time. Continued strong earnings reports could help push markets higher and continue this rally.
Have a great week!
The opinions expressed herein are those of Michael Hilger and not necessarily those of Raymond James & Associates, Inc., and are subject to change without notice. The information contained in this report does not purport to be a complete description of the securities, markets, or developments referred to in this material. There is no assurance any of the trends mentioned will continue or forecasts will occur. The information has been obtained from sources considered to be reliable, but Raymond James does not guarantee that the foregoing material is accurate or complete. Investing involves risk and you may incur a profit or loss regardless of strategy selected.
The information contained herein is general in nature and does not constitute legal or tax advice. Inclusion of these indexes is for illustrative purposes only. Keep in mind that individuals cannot invest directly in any index, and index performance does not include transaction costs or other fees, which will affect actual investment performance. Individual investor's results will vary. Past performance does not guarantee future results. The Dow Jones Industrial Average (INDU) is the most widely used indicator of the overall condition of the stock market, a price-weighted average of 30 actively traded blue chip stocks, primarily industrials. Standard & Poor's 500 (SPX) is a basket of 500 stocks that are considered to be widely held. The S&P 500 index is weighted by market value, and its performance is thought to be representative of the stock market as a whole. The S&P 500 is an unmanaged index of widely held stocks that is generally representative of the U.S. stock market. Keep in mind that individuals cannot invest directly in any index, and index performance does not include transaction costs and other fees, which will affect investment performance. Individual investor’s results will vary. The NASDAQ Composite Index (COMP.Q) is an index that indicates price movements of securities in the over-the-counter market. It includes all domestic common stocks in the NASDAQ System (approximately 5,000 stocks) and is weighted according to the market value of each listed issue. The NASDAQ-100 (^NDX) is a modified capitalization-weighted index. It is based on exchange, and it is not an index of U.S.-based companies. The Russell 2000 index is an unmanaged index of small cap securities which generally involve greater risks. The Nasdaq-100 Index includes 100 of the largest domestic and international non-financial companies listed on The Nasdaq Stock Market based on market capitalization. The Index reflects companies across major industry groups including computer hardware and software, telecommunications, retail/wholesale trade and biotechnology. It does not contain securities of financial companies including investment companies.
U.S. government bonds and Treasury notes are guaranteed by the U.S. government and, if held to maturity, offer a fixed rate of return, and guaranteed principal value. U.S. government bonds are issued and guaranteed as to the timely payment of principal and interest by the federal government. Treasury notes are certificates reflecting intermediate-term (2 - 10 years) obligations of the U.S. government.
The companies engaged in business related to a specific sector are subject to fierce competition and their products and services may be subject to rapit obsolescence. There are additional risks associated with investing in an individual sector, including limited diversification.
International investing involves special risks, including currency fluctuations, differing financial accounting standards, and possible political and economic volatility.
The companies engaged in the communications and technology industries are subject to fierce competition and their products and services may be subject to rapid obsolescence.
Gold is subject to the special risks associated with investing in precious metals, including but not limited to: price may be subject to wide fluctuation; the market is relatively limited; the sources are concentrated in countries that have the potential for instability; and the market is unregulated.
The information contained within this commercial email has been obtained from sources considered reliable, but we do not guarantee the foregoing material is accurate or complete.
Any information is not a complete summary or statement of all available data necessary for making an investment decision and does not constitute a recommendation. Prior to making an investment decision, please consult with your financial advisor about your individual situation.
Charts are reprinted with permission, further reproduction is strictly prohibited.
If you would like to be removed from this e-Mail Alert Notification, PLEASE click the Reply button, type "remove" or "unsubscribe" in the subject line and include your name in the message, then click Send.
