
The Week in Review 02/12/2024
“Chance favours the prepared mind.” – Louis Pasteur
Good Morning,
It was another winning week for the stock market.
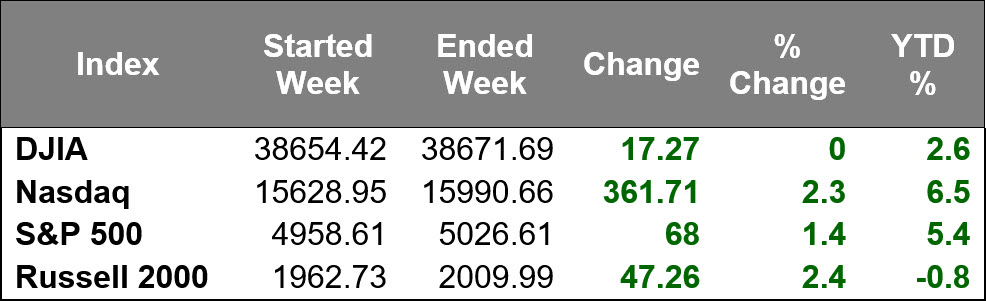
Small cap stocks saw some rebound action after underperforming to start the year. The Russell 2000 jumped 2.4% last week. The S&P 500 closed above 5,000 for the first time, drawing support from gains in the mega cap and semiconductor spaces.
Many stocks participated in a relatively broad advance. The equal-weighted S&P 500 gained 0.5% this week. There still has not been any concerted selling interest despite reports that the market is overbought in the short-term, which has acted as its own upside catalyst.
Another catalyst for the upside price action came in the form of positive responses to some earnings news. Ford, Eli Lilly, DuPont, Arm Holdings, and Walt Disney were among the standout earnings-related winners this week.
Meanwhile, Amgen and PayPal were some of the more influential earnings-related laggards.
Notably, this week's broad advance occurred despite sharp declines in Treasuries. The 2-yr note yield rose 12 basis points to 4.50% and the 10-yr note yield rose 16 basis points to 4.19%.
The increased selling in Treasuries started week before last in response to ongoing strength in economic data of late that has the market repricing rate cut expectations. This also followed comments from Fed Chair Jerome Powell the previous weekend, who said on 60 Minutes that the Fed needs to see more evidence that inflation is moving sustainably down to its 2% target before lowering rates.
Last week's release of the January ISM Services PMI featured an acceleration in services sector activity in January, replete with a pickup in new orders, employment, and prices. The weekly jobless claims report showed a decrease in the number of claims.
Also, the annual CPI revisions were released last week, garnering added attention due to potential implications for the Fed's rate cut path. The revisions were relatively friendly since they did not alter the market's view on inflation much.
Treasuries did not respond favorably to last week's slate of strong auctions, including a $25 billion 30-yr bond offering, a $54 billion 3-yr note sale, and $42 billion 10-yr note auction.
The probability of a 25 basis points rate cut to 5.00-5.25% at the May FOMC meeting is 63.1% now, down from 73.2% one week ago, according to the CME FedWatch Tool.
Market Snapshot…
- Oil Prices – Oil prices rose as hope for a ceasefire in the Israel-Hamas war faded. West Texas Intermediate crude futures (WTI) added 62 cents to settle at $76.84 a barrel. Brent crude futures added 56 cents to close at $82.19 a barrel.
- Gold– Gold prices slipped pressured by elevated Treasury yields. Spot Gold was down 0.5% to $2,022.86 per ounce while U.S. gold futures settled 0.4% lower to $2,038.7. Silver finished the week at $22.594.
- S. Dollar– The dollar index fell 0.029% to 104.08. Euro/US$ exchange rate is now 1.079.
- S. Treasury Rates– The yield on the 10-year Treasury note was flat at 4.173% after investors weighed encouraging consumer price index revisions.
- Asian shares were mixed in overnight trading.
- European markets are trading mostly higher.
- Domestic markets are trading slightly higher this morning.
We’re coming into the back nine of earnings season with 67% of S&P 500 companies reporting. So far, the blended earnings growth rate is 2.9% year-over-year.
Even though we’re two-thirds of the way through the season, there are still many companies left to report. This week we will hear from Waste Management, Airbnb, AIG, Cisco, Kraft Heinz, Deere, and Archer-Daniels-Midland among others.
On the economic front, we will receive January’s CPI report on Tuesday, Retail Sales on Thursday, and PPI report on Friday. Economic releases have widely been better than expected in recent months and we expect this trend to continue.
Have a wonderful week!
The opinions expressed herein are those of Michael Hilger and not necessarily those of Raymond James & Associates, Inc., and are subject to change without notice. The information contained in this report does not purport to be a complete description of the securities, markets, or developments referred to in this material. There is no assurance any of the trends mentioned will continue or forecasts will occur. The information has been obtained from sources considered to be reliable, but Raymond James does not guarantee that the foregoing material is accurate or complete. Investing involves risk and you may incur a profit or loss regardless of strategy selected.
The information contained herein is general in nature and does not constitute legal or tax advice. Inclusion of these indexes is for illustrative purposes only. Keep in mind that individuals cannot invest directly in any index, and index performance does not include transaction costs or other fees, which will affect actual investment performance. Individual investor's results will vary. Past performance does not guarantee future results. The Dow Jones Industrial Average (INDU) is the most widely used indicator of the overall condition of the stock market, a price-weighted average of 30 actively traded blue chip stocks, primarily industrials. Standard & Poor's 500 (SPX) is a basket of 500 stocks that are considered to be widely held. The S&P 500 index is weighted by market value, and its performance is thought to be representative of the stock market as a whole. The S&P 500 is an unmanaged index of widely held stocks that is generally representative of the U.S. stock market. Keep in mind that individuals cannot invest directly in any index, and index performance does not include transaction costs and other fees, which will affect investment performance. Individual investor’s results will vary. The NASDAQ Composite Index (COMP.Q) is an index that indicates price movements of securities in the over-the-counter market. It includes all domestic common stocks in the NASDAQ System (approximately 5,000 stocks) and is weighted according to the market value of each listed issue. The NASDAQ-100 (^NDX) is a modified capitalization-weighted index. It is based on exchange, and it is not an index of U.S.-based companies. The Russell 2000 index is an unmanaged index of small cap securities which generally involve greater risks. The Nasdaq-100 Index includes 100 of the largest domestic and international non-financial companies listed on The Nasdaq Stock Market based on market capitalization. The Index reflects companies across major industry groups including computer hardware and software, telecommunications, retail/wholesale trade and biotechnology. It does not contain securities of financial companies including investment companies.
U.S. government bonds and Treasury notes are guaranteed by the U.S. government and, if held to maturity, offer a fixed rate of return, and guaranteed principal value. U.S. government bonds are issued and guaranteed as to the timely payment of principal and interest by the federal government. Treasury notes are certificates reflecting intermediate-term (2 - 10 years) obligations of the U.S. government.
The companies engaged in business related to a specific sector are subject to fierce competition and their products and services may be subject to rapit obsolescence. There are additional risks associated with investing in an individual sector, including limited diversification.
International investing involves special risks, including currency fluctuations, differing financial accounting standards, and possible political and economic volatility.
The companies engaged in the communications and technology industries are subject to fierce competition and their products and services may be subject to rapid obsolescence.
Gold is subject to the special risks associated with investing in precious metals, including but not limited to: price may be subject to wide fluctuation; the market is relatively limited; the sources are concentrated in countries that have the potential for instability; and the market is unregulated.
The information contained within this commercial email has been obtained from sources considered reliable, but we do not guarantee the foregoing material is accurate or complete.
Any information is not a complete summary or statement of all available data necessary for making an investment decision and does not constitute a recommendation. Prior to making an investment decision, please consult with your financial advisor about your individual situation.
Charts are reprinted with permission, further reproduction is strictly prohibited.
