
The Week In Review 01/29/2024
The supreme art of war is to subdue the enemy without fighting ~ Sun Tzu
Good Morning,
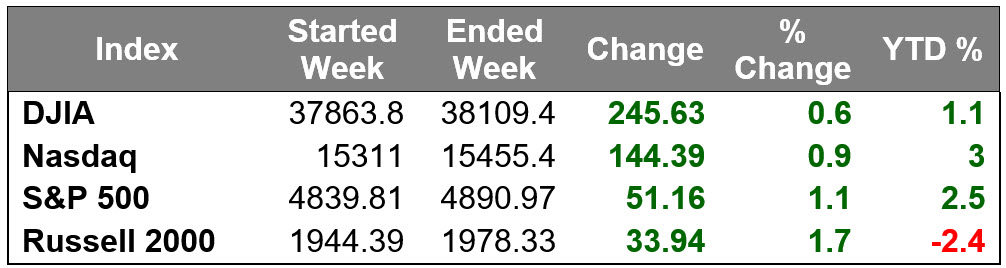
The stock market logged more gains last week, which brought the S&P 500 to fresh record highs.
Gains were broader based compared to the previous week, which featured the outperformance of mega cap stocks.
The broadening out of buying activity left eight of the 11 S&P 500 sectors higher last week.
The energy sector saw the largest gain, jumping 5.2%, followed by the communication services sector, which gained 4.5%. The three laggards to log a decline were consumer discretionary (-1.4%), real estate (-0.5%), and health care (-0.2%).
The consumer discretionary sector was clipped by a big loss in shares of Tesla, which dropped 13.6% last week after disappointing earnings and guidance. Microsoft was a winning standout from the mega cap space, topping a $3 trillion market cap for the first-time last week.
Other notable names that disappointed with earnings and/or guidance in addition to Tesla included Humana, 3M, Johnson & Johnson, AT&T, DuPont, and Kimberly-Clark.
Intel, Texas Instruments, and KLA Corporation also sold off after reporting quarterly results, which weighed on the broader semiconductor space and offset earnings-related strength in ASML.
Companies that received positive reactions to earnings results and/or guidance included Netflix, United Airlines, Verizon, and Procter & Gamble.
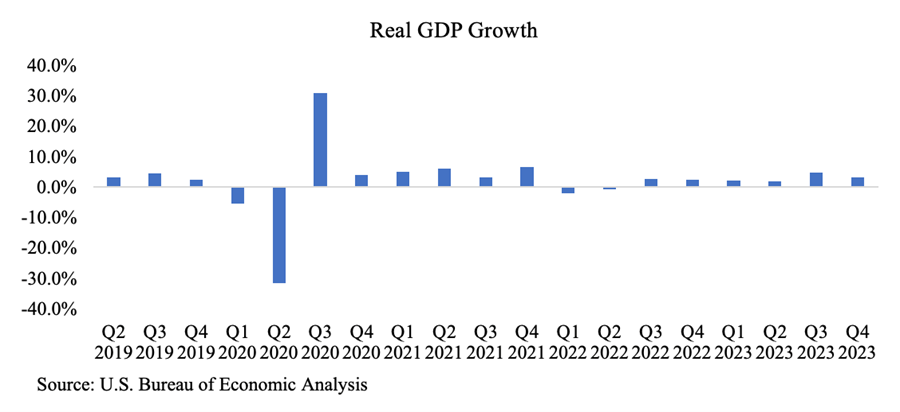
Last week brought some pleasing data in terms of ongoing strength in the economy and cooling inflation. The Advance Q4 GDP report showed that real GDP rose 3.3% versus an expected 2.0% and the GDP Price Deflator increased 1.5% versus an expected 2.8%.
Personal income increased 0.3% month-over-month in December, as expected, but personal spending increased a much stronger-than-expected 0.7% (consensus 0.4%). The inflation gauges were spot-on with expectations. The PCE Price Index was up 0.2% month-over-month and so was the core-PCE Price Index, which excludes food and energy.
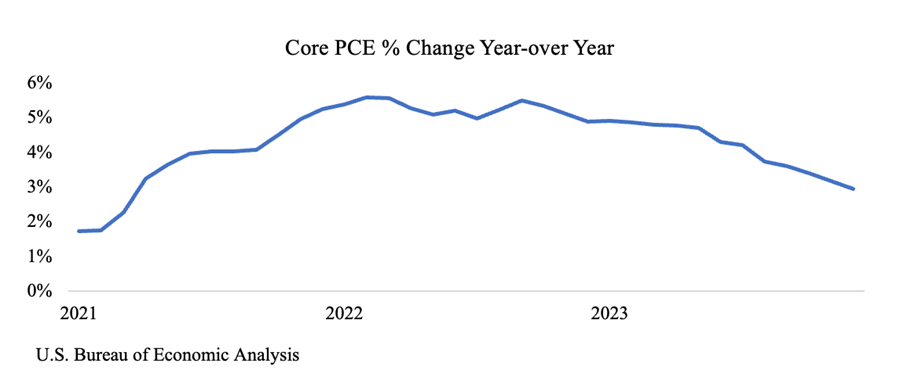
With the December changes, the Fed’s favorite metric on inflation, the PCE Price Index was up 2.6% year-over-year, unchanged from November, and the core PCE Price Index was up 2.9% -- the lowest since March 2021 -- versus 3.2% in November.
The U.S. economy continued its better-than-expected growth in the fourth quarter, growing at an annualized 3.3% in the fourth quarter, and 2.5% for the entire year.
The growth was above the 2% expected by most economists. The overall rate is at 3.1% for the full year.
Market Snapshot…
- Oil Prices – Oil prices closed out their best week as a better economy raised hopes for more robust crude demand this year. West Texas Intermediate crude futures (WTI) gained 65 cents, or 0.84%, to close at $78.01 a barrel. Brent crude futures were up $1.12, or 1.36%, to close at $83.55 a barrel.
- Gold– Gold prices held steady as investors eyed the Fed’s policy meeting due next week. Spot Gold was down 0.1% to $2,017.94 per ounce while U.S. gold futures were little changed to $2,018.1. Silver finished last week at $22.872.
- U.S. Dollar– The dollar index inched lower due to data inflation. The dollar index was down 0.1% at 103.41. Euro/US$ exchange rate is now 1.082.
- U.S. Treasury Rates– Treasury yields moved only slightly as investors assessed inflation readings. The yield on the 10-year Treasury note was up less than 1 basis point at 4.141%.
- Asian shares were higher in overnight trading.
- European markets are trading mixed.
- Domestic markets are trading slightly higher this morning.
This week will feature the Fed’s first policy meeting of 2024. We expect it to hold the federal funds rate steady at a range of 5.25-5.50%. Chairman Powell will speak following the meeting, where he will hopefully provide some clarity on when rate cuts could be expected. Many still expect the cutting cycle to begin in March.
Have a wonderful week!
The opinions expressed herein are those of Michael Hilger and not necessarily those of Raymond James & Associates, Inc., and are subject to change without notice. The information contained in this report does not purport to be a complete description of the securities, markets, or developments referred to in this material. There is no assurance any of the trends mentioned will continue or forecasts will occur. The information has been obtained from sources considered to be reliable, but Raymond James does not guarantee that the foregoing material is accurate or complete. Investing involves risk and you may incur a profit or loss regardless of strategy selected
The information contained herein is general in nature and does not constitute legal or tax advice. Inclusion of these indexes is for illustrative purposes only. Keep in mind that individuals cannot invest directly in any index, and index performance does not include transaction costs or other fees, which will affect actual investment performance. Individual investor's results will vary. Past performance does not guarantee future results. The Dow Jones Industrial Average (INDU) is the most widely used indicator of the overall condition of the stock market, a price-weighted average of 30 actively traded blue chip stocks, primarily industrials. The Dow Jones Transportation Average (DJTA, also called the "Dow Jones Transports") is a U.S. stock market index from the Dow Jones Indices of the transportation sector, and is the most widely recognized gauge of the American transportation sector. Standard & Poor's 500 (SPX) is a basket of 500 stocks that are considered to be widely held. The S&P 500 index is weighted by market value, and its performance is thought to be representative of the stock market as a whole. The S&P 500 is an unmanaged index of widely held stocks that is generally representative of the U.S. stock market. Keep in mind that individuals cannot invest directly in any index, and index performance does not include transaction costs and other fees, which will affect investment performance. Individual investor’s results will vary. The NASDAQ Composite Index (COMP.Q) is an index that indicates price movements of securities in the over-the-counter market. It includes all domestic common stocks in the NASDAQ System (approximately 5,000 stocks) and is weighted according to the market value of each listed issue. The NASDAQ-100 (^NDX) is a modified capitalization-weighted index. It is based on exchange, and it is not an index of U.S.-based companies. The Russell 2000 index is an unmanaged index of small cap securities which generally involve greater risks.
The Nasdaq-100 Index includes 100 of the largest domestic and international non-financial companies listed on The Nasdaq Stock Market based on market capitalization. The Index reflects companies across major industry groups including computer hardware and software, telecommunications, retail/wholesale trade and biotechnology. It does not contain securities of financial companies including investment companies.
U.S. government bonds and Treasury notes are guaranteed by the U.S. government and, if held to maturity, offer a fixed rate of return, and guaranteed principal value. U.S. government bonds are issued and guaranteed as to the timely payment of principal and interest by the federal government. Treasury notes are certificates reflecting intermediate-term (2 - 10 years) obligations of the U.S. government.
International investing involves special risks, including currency fluctuations, differing financial accounting standards, and possible political and economic volatility.
The companies engaged in the communications and technology industries are subject to fierce competition and their products and services may be subject to rapid obsolescence.
Gold is subject to the special risks associated with investing in precious metals, including but not limited to: price may be subject to wide fluctuation; the market is relatively limited; the sources are concentrated in countries that have the potential for instability; and the market is unregulated.
The information contained within this commercial email has been obtained from sources considered reliable, but we do not guarantee the foregoing material is accurate or complete.
Any information is not a complete summary or statement of all available data necessary for making an investment decision and does not constitute a recommendation. Prior to making an investment decision, please consult with your financial advisor about your individual situation.
Charts are reprinted with permission, further reproduction is strictly prohibited.
If you would like to be removed from this e-Mail Alert Notification, PLEASE click the Reply button, type "remove" or "unsubscribe" in the subject line and include your name in the message, then click Send.
