
The Week In Review 01/22/2024
“A cynic is a man who knows the price of everything, and the value of nothing.” ~ Oscar Wilde
Good Morning ,
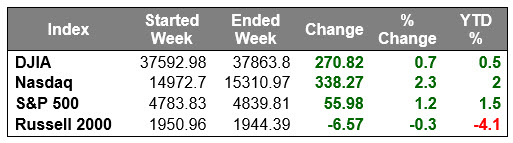
Our holiday shortened week closed on a strong note… with the S&P 500 sitting at a fresh record high (4,839.81) and up 1.5% for the year.
The Nasdaq Composite is up 2.0% for the year thanks to last week's gain and the Dow Jones Industrial Average is up 0.5%.
Gains were largely driven by outperforming mega cap and semiconductor shares… NVIDIA was a standout winner, enjoying a 8.7% gain on the week.
The broader market saw softer price action due to rising market rates as participants recalibrated rate cut expectations due to comments from some Fed officials.
More strong economic data that is not likely to persuade the Fed to cut rates as soon, or as much as the markets hoped. The 2-yr note yield jumped 26 basis points to 4.41% and the 10-yr note yield climbed 20 basis points to 4.15%.
Fed Governor Waller (FOMC voter) indicated that the Fed could begin cutting rates this year, but reiterated the Fed's estimate for three cuts rather than six cuts that the market expects.
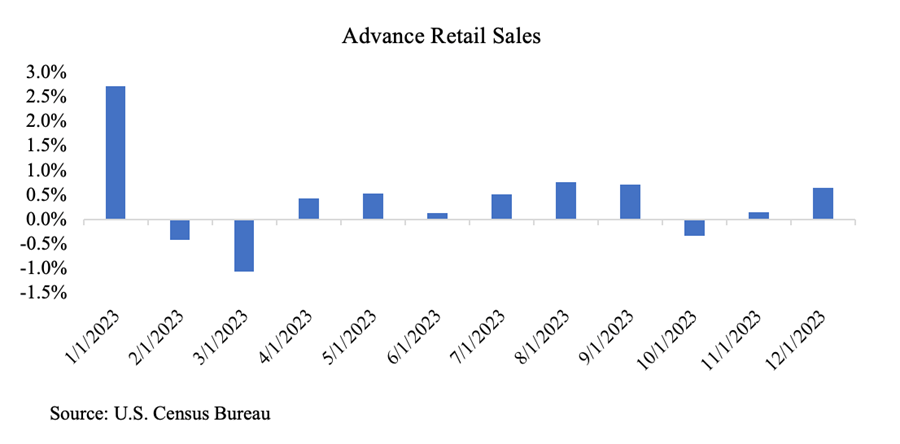
The December Retail Sales report, the Housing Starts data for December, and weekly initial jobless claims were all stronger than expected and the preliminary reading of the University of Michigan's Consumer Sentiment Index for January was well ahead of estimates, hitting its highest level since July 2021 with year-ahead inflation expectations decelerating to 2.9% from 3.1%, a rate not seen in just over three years.
The implied likelihood of a 25-bps cut at the March FOMC meeting now sits at 45.4% versus 81.0% last Friday.
Market participants were also digesting more earnings results from the likes of Goldman Sachs, Morgan Stanley, and Dow component Travelers, which garnered mixed reactions.
Five of the 11 S&P 500 sectors registered gains last week. The heavily weighted information technology sector was the top gainer by a wide margin, jumping 4.3% thanks to the strength in NVDA and its other mega cap components. Meanwhile, the rate-sensitive utilities (-3.7%) and real estate (-2.1%) sectors saw some of the largest declines.
Market Snapshot…
- Oil Prices – Oil prices were flat but headed for a weekly gain. West Texas Intermediate crude futures (WTI) fell 10 cents to close at $73.98 a barrel. Brent crude futures fell 10 cents to close at $79 a barrel.
- Gold– Gold prices firmed but still fell for the second week. Spot Gold rose nearly 0.3% to $2,027.98 per ounce while U.S. gold futures rose around 0.5% higher to $2,030.60. Silver finished the week at $22.711.
- U.S. Dollar– The dollar index edged lower but seemed poised for a weekly gain. The dollar index was down 0.3% at 103.26 but was up 0.8% for the week. Euro/US$ exchange rate is now 1.09.
- U.S. Treasury Rates– Treasury yields were little changed Friday. The yield on the 10-year Treasury note was marginally lower at 4.14%.
- Asian shares were mixed in overnight trading.
- European markets are trading higher.
- Domestic markets are trading in the green this morning.
The American consumer once again proved resilient in the present economy. Many expected households to pinch pennies during the holiday season but that doesn’t appear to be the case.
This week’s highlight will be the preliminary GDP report for the fourth quarter as well as December’s PCE report. GDP posted good growth in the first three quarters of 2023, including a 4.9% print in the most recent quarter.
We believe this report will be a bit tamer, but still come in positive, especially given the strength of consumer spending which makes up 70% of GDP. The consensus forecast is 1.8%.
Both reports will be the last major releases before the Fed’s first meeting of 2024 on January 30 and 31.
Have a wonderful week!
The opinions expressed herein are those of Michael Hilger and not necessarily those of Raymond James & Associates, Inc., and are subject to change without notice. The information contained in this report does not purport to be a complete description of the securities, markets, or developments referred to in this material. There is no assurance any of the trends mentioned will continue or forecasts will occur. The information has been obtained from sources considered to be reliable, but Raymond James does not guarantee that the foregoing material is accurate or complete. Investing involves risk and you may incur a profit or loss regardless of strategy selected
The information contained herein is general in nature and does not constitute legal or tax advice. Inclusion of these indexes is for illustrative purposes only. Keep in mind that individuals cannot invest directly in any index, and index performance does not include transaction costs or other fees, which will affect actual investment performance. Individual investor's results will vary. Past performance does not guarantee future results. The Dow Jones Industrial Average (INDU) is the most widely used indicator of the overall condition of the stock market, a price-weighted average of 30 actively traded blue chip stocks, primarily industrials. The Dow Jones Transportation Average (DJTA, also called the "Dow Jones Transports") is a U.S. stock market index from the Dow Jones Indices of the transportation sector, and is the most widely recognized gauge of the American transportation sector. Standard & Poor's 500 (SPX) is a basket of 500 stocks that are considered to be widely held. The S&P 500 index is weighted by market value, and its performance is thought to be representative of the stock market as a whole. The S&P 500 is an unmanaged index of widely held stocks that is generally representative of the U.S. stock market. Keep in mind that individuals cannot invest directly in any index, and index performance does not include transaction costs and other fees, which will affect investment performance. Individual investor’s results will vary. The NASDAQ Composite Index (COMP.Q) is an index that indicates price movements of securities in the over-the-counter market. It includes all domestic common stocks in the NASDAQ System (approximately 5,000 stocks) and is weighted according to the market value of each listed issue. The NASDAQ-100 (^NDX) is a modified capitalization-weighted index. It is based on exchange, and it is not an index of U.S.-based companies. The Russell 2000 index is an unmanaged index of small cap securities which generally involve greater risks.
The Nasdaq-100 Index includes 100 of the largest domestic and international non-financial companies listed on The Nasdaq Stock Market based on market capitalization. The Index reflects companies across major industry groups including computer hardware and software, telecommunications, retail/wholesale trade and biotechnology. It does not contain securities of financial companies including investment companies.
U.S. government bonds and Treasury notes are guaranteed by the U.S. government and, if held to maturity, offer a fixed rate of return, and guaranteed principal value. U.S. government bonds are issued and guaranteed as to the timely payment of principal and interest by the federal government. Treasury notes are certificates reflecting intermediate-term (2 - 10 years) obligations of the U.S. government.
International investing involves special risks, including currency fluctuations, differing financial accounting standards, and possible political and economic volatility.
The companies engaged in the communications and technology industries are subject to fierce competition and their products and services may be subject to rapid obsolescence.
Gold is subject to the special risks associated with investing in precious metals, including but not limited to: price may be subject to wide fluctuation; the market is relatively limited; the sources are concentrated in countries that have the potential for instability; and the market is unregulated.
The information contained within this commercial email has been obtained from sources considered reliable, but we do not guarantee the foregoing material is accurate or complete.
Any information is not a complete summary or statement of all available data necessary for making an investment decision and does not constitute a recommendation. Prior to making an investment decision, please consult with your financial advisor about your individual situation.
Charts are reprinted with permission, further reproduction is strictly prohibited.
If you would like to be removed from this e-Mail Alert Notification, PLEASE click the Reply button, type "remove" or "unsubscribe" in the subject line and include your name in the message, then click Send.
