Market Leadership Changes Are Common
“The stock market always does exactly what it is supposed to do, but never when.” – Richard L. Russell
Stock markets tend to have extended periods of above average returns followed by poor market environments. The good news is that the underlying components including ‘growth’ and ‘value,’ large, mid and small caps and U.S. and international generally do not move in lockstep. By holding meaningful allocations in all these market segments, investors can lessen the risks associated with being concentrated in any segments that despite our intuition and preferences perform poorly. The table below shows the annualized total return for various Russell indexes with specified starting and ending dates.
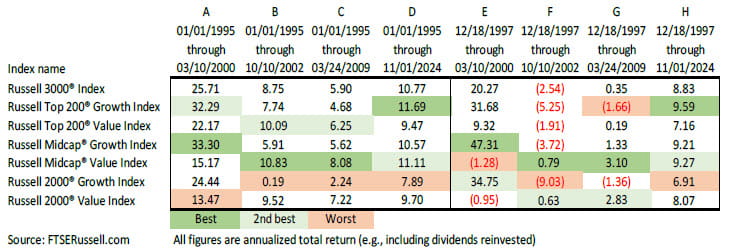
As you can see in column A, the growth segments handily outpaced their value counterparts in that 5+ year period. However, when you include additional years, index leadership changes occurred (as shown in columns B, C & D). Indeed from 1/01/1995 thru 11/01/24 (nearly 30 years), we see that the value indexes outperformed their growth counterparts in each of these periods. The lone exception is the Russell 200 growth vs value. Here the growth outpaced value by over 2% annually. Index leadership changes are common.
In the right half of that same chart, I changed the start date in columns E thru H to 12/18/97. This is to illustrate that at that time, many investors in surveys conducted at that time, believed that stocks would post significant gains for many years to come. However, as the index return data shows, that was not the case.
At the top of the next page, please see columns I thru L. Since March 10, 2000 (the then peak in the NASDAQ index), the growth segments (mega caps, mid and small) all performed poorly for many years. More than 24 years later, only the Russell Midcap value index has delivered a double-digit return (column L). These figures include reinvested dividends (e.g., total returns).
Since the top of the market in early March 2000, ‘value’ has generally outpaced ‘growth’ and small and midcaps have outpaced the returns for Mega caps (e.g., columns I thru L). That said, we recognize that growth and value both play important roles in portfolio diversification. Indeed, sometimes growth segments are attractively priced and value segments prove to be expensive. It is worth noting that the Russell 200 growth has outpaced the Russell 200 value by 0.8% annually since March 10, 2000. While being early is often part and parcel of valuation-based investing, we believe it is better to position for potential reversals ahead of when the markets change course.
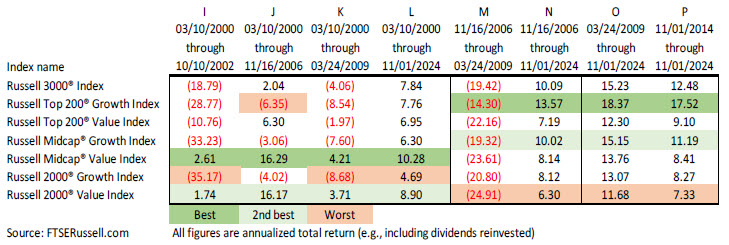
As you can see in column M above, all market segments performed poorly through the market’s bottom in March 2009. However, from that date through November 1, 2024 (e.g., column N) all have provided decent gains, especially the Russell 200 and Russell Midcap growth indexes. In the final two columns (e.g., O & P), growth segments – especially mega caps have once again led performance by a wide margin. Column P marks the date when we formed HWP and joined Raymond James (e.g., 10 years ago). Similar to what we saw in the late 1990s bull market, the Russell 200 growth has performed very well due to solid gains in underlying EPS (earnings per share) combined with a significant increase in valuation metrics. Returns for mid and small caps, especially ‘value’ have lagged these strong returns by a considerable margin. At present, their valuation metrics are attractive to us, compared to their historical metrics and relative to growth segments. We believe value segments could prove more rewarding over the next 5, 7, 10 or more years. Time will tell.
In summary, we believe it is likely we will once again experience significant changes in index leadership. That’s because market segments tend to go from unduly cheap to unsustainably expensive. The good news, market segments do not move in lockstep. At present, lagging segments are available at relatively low valuation metrics.i That was the case in early 2000. We believe it is entirely possible that market segments including U.S. mid and small caps, international stocks (and the value segments of these indexes in particular), will ultimately lead returns again. We do not know where the inflection point lies but, we expect to stay the course. We trust in broad diversification and on an ongoing basis, we will seek to identify out-of-favor segments that are priced attractively over a multi-year horizon.
Warmest regards,
W. Richard Jones, CFA
Partner, Harmony Wealth Partners
Low valuations provide a good starting point for favorable prospective returns. Often low PE ratios also translate into relative high dividend yields. Those dividends plus decent EPS growth alone can translate into high single digit returns. If the PE expands, those high single digit fundamentals can become appreciably higher total returns. The opposite is true for securities that are priced at the top of their valuation range. Valuation declines can partially or fully offset the growth in underlying earnings and cash flow per share.
The foregoing information has been obtained from sources considered to be reliable, but we do not guarantee that it is accurate or complete, it is not a statement of all available data necessary for making an investment decision, and it does not constitute a recommendation. There is no assurance any of the trends mentioned will continue. Any opinions are those of Richard Jones and not necessarily those of Raymond James. Expressions of opinion are as of this date and are subject to change without notice. There is no guarantee that these statements, opinions or forecasts provided herein will prove to be correct. Investing involves risk and you may incur a profit or loss regardless of strategy selected. Diversification and asset allocation does not ensure a profit or protect against a loss. Holding investments for the long term does not ensure a profitable outcome.
The Russell 3000 Index measures the performance of the 3,000 largest U.S. companies based on total market capitalization, which represents approximately 98% of the investable U.S. equity market. The Russell Top 200 Growth Index measures the performance of the especially large cap segment of the US equity universe represented by stocks in the largest 200 by market cap. The Russell Top 200 Value Index measures the performance of the especially large cap segment of the US equity universe represented by stocks in the largest 200 by market cap that exhibit value characteristics. The Russell Mid-cap Growth Index: Measures the performance of those Russell Mid-cap companies with higher price-to- book ratios and higher forecasted growth values. The Russell Mid-cap Value Index measures the performance of those Russell Mid-cap companies with lower price-to-book ratios and lower forecasted growth values. The Russell 2000 Growth Index measures the performance of those Russell 2000 companies with higher price-to-book ratios and higher forecasted growth values. The Russell 2000 Value Index measures the performance of those Russell 2000 companies with lower price-to-book ratios and lower forecasted growth values. The NASDAQ composite is an unmanaged index of securities traded on the NASDAQ system. Inclusion of indexes is for illustrative purposes only. Keep in mind that individuals cannot invest directly in any index, and index performance does not include transactions costs or other fees, which will affect actual investment performance. Past performance does not guarantee future results.
Securities offered through Raymond James Financial Services, Inc., Member FINRA/SIPC. Investment advisory services offered through Raymond James Financial Services Advisors, Inc. Harmony Wealth Partners is not a registered broker/dealer and is independent of Raymond James Financial Services.
