Offense and Defense
What does the graph below tell us? We believe that it is telling us that the “bond vigilantes” are back.
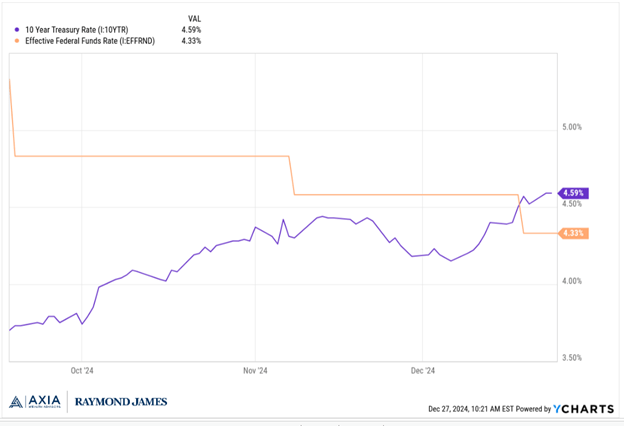
The graph shows the orange line which is the interest rate that the Federal Reserve (Fed) controls. The Fed cut this rate 1/2% in September, then cut ¼% again in November and December, for a total decrease of 1%.
It also shows the purple line which is the yield on the ten-year Treasury bond during that time. As you can see, it has increased by about 1%.
What does this mean?
You may remember the term “bond vigilantes” from the Clinton administration. Robert Rubin was the Treasury Secretary and he told President Clinton that the bond market has a voice in their policies. If the investors (bond vigilantes) in the bond market detect inflationary policies, they will demand a higher interest rate to compensate them for that risk. Which means the government will have to pay higher interest rates to borrow to finance the deficit which results from spending more than we receive in the form of taxes.
And that seems to be what the bond market is telling us again.
Regardless of the short-term rate that the Fed controls, which influences money market funds and other very short-term rates, longer term rates are increasing due to concerns by investors about an inflationary fiscal policy.
Fiscal policy is controlled by Congress and represents their policy regarding the level of taxes and spending.
We have written about this several times, but we want you to be aware of the different moving parts that affect our economy as well as your portfolio here.
Do these issues affect the stock market as well as the bond market? They can.
The stock market competes for your dollars against a range of choices that investors have. When Treasury rates for longer term investors increase, they may be perceived as providing a more attractive level of risk adjusted return.
During the past 15 years or so, rates were so low that the term “TINA” became a term used in the financial jargon, meaning “There Is No Alternative” to stocks. But when rates go from 1.5% to 4.7% in the U.S. Treasury bond market, as they have in the last couple of years, then there becomes an alternative for investors.
How investors weigh the comparative attractiveness of the expected returns of the bond market versus the stock market is impossible to know in advance.
Once again, we go to our crystal ball which is still very cloudy, so we opt for a very diversified approach. The table below shows various asset class performances for the last 20 years as well as how the diversified portfolio (gray box) has done. The gray box is a blend of 60% stocks and 40% bonds (both short-term and long-term bonds).
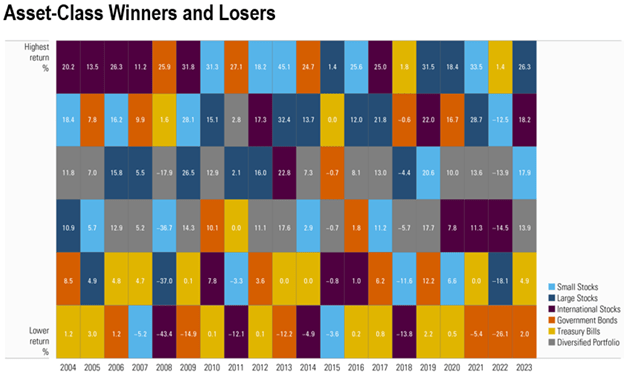
Chart Source: Morningstar
We will err on the diversified approach, not only to mitigate risks but also to expand your range of upside opportunities.
We consider both sides of the investment goals (growth and capital preservation) to be equally important. Having a good offense and defense not only works in sports, but in your portfolios also.
Thank you as always for the trust you have placed in us. Please do not hesitate to contact us with any change in your life or any questions you may have for us.
Wishing you a Healthy, Happy and Safe New Year!
Thanks,
Beach
Disclosure: The foregoing information has been obtained from sources considered to be reliable, but we do not guarantee that it is accurate or complete, it is not a statement of all available data necessary for making an investment decision, and it does not constitute a recommendation. Any opinions are those of the author and not necessarily those of Raymond James. There is an inverse relationship between interest rate movements and bond prices. Generally, when interest rates rise, bond prices fall and when interest rates fall, bond prices generally rise. Investing involves risk and you may incur a profit or loss regardless of strategy selected, including a long-term holding period, diversification, and asset allocation.
