A methodical approach that moves with the tides
Since 1896, the U.S. equity market, as represented by the Dow Jones Industrial Average, has experienced trends upward, as well as lengthy periods of time when the market stagnates or moves lower. Eight alternating cycles have occurred since then, averaging 14 years in duration.
What does this mean to you as an investor? Well, if you start accumulating meaningful, investable wealth around the age of 40 and live to be 85 years old, you’ll probably witness these market cycles. Since it’s likely you’ll experience three alternate cycles over the course of your investing years, it’s important to have effective strategies available during both rising (bull) markets and falling (bear or fair) markets.
Supply, demand and your portfolio
One investing approach that we believe can be effective in both rising and falling markets is point and figure methodology. Since the late 1800s, this technique has monitored supply and demand with an eye on developing trends. Charles Dow, the original editor of the Wall Street Journal, was the methodology’s first proponent. Although a fundamentalist at heart, he still appreciated the merits of recording price action and understanding the supply and demand relationship in any investment. Although developed more than a century ago, at its core this methodology remains a logical, organized way to record the supply and demand relationship in any investment vehicle. As consumers and investors, we’re innately familiar with the forces of supply and demand as we experience its impact in our daily lives The very same forces that cause price movement in the supermarket also trigger price movement in the financial markets. Tomatoes consumed during winter months are more expensive, although they don’t taste as good and have a shorter shelf life than those sent to market in July.
In a free market of any kind, if there are more buyers than sellers the price will move higher. If there are more sellers than buyers, the price must move lower. If buying and selling are equal, the price will remain the same. By charting this movement of prices in an organized manner we hope to ascertain who is winning that battle – sellers or buyers, supply or demand. With this ability to evaluate changes in the market, we have taken the first step toward becoming responsive to both bullish and bearish financial market cycles.
Past performance may not be indicative of future results. There is no assurance these trends will continue or that the forecasts mentioned will occur. The market value of securities fluctuates and you may incur a profit or a loss.
Asset allocation and diversification cannot eliminate the risk of fluctuating prices and uncertain returns nor can they guarantee profit or protect against loss in declining markets.
The Dow Jones Industrial Average (DJIA), commonly known as “The Dow” is an index representing 30 stock of companies maintained and reviewed by the editors of the Wall Street Journal. An investment cannot be made in this index. The performance mentioned does not include fees and charges, which would reduce an investor’s returns.
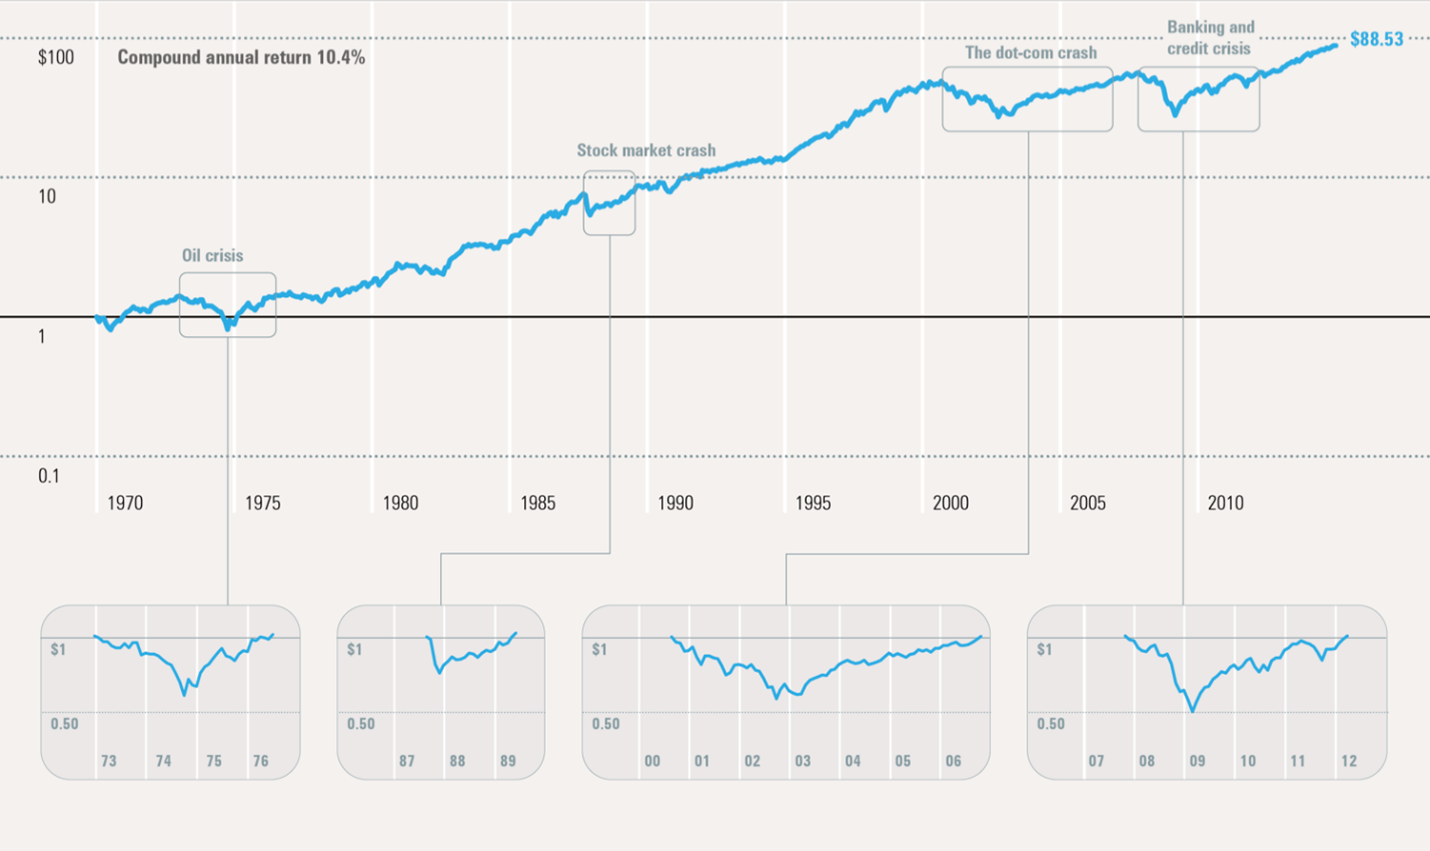
Four market crises defined as a drop of 25% or more in the Ibbotson® Large Company Stock Index

Past performance is no guarantee of future results. This is for illustrative purposes only and not indicative of any investment. An investment cannot be made directly in an index.Four market crises defined as a drop of 25% or more in the Ibbotson® Large Company Stock Index. © 2015 Morningstar. All Rights Reserved.
