RELATIVE STRENGTH NEWSLETTER - 2ND QUARTER 2023
Relative Strength
The second quarter of 2023 proved to be much like the first- a continued rally among last years’ weakest areas, namely large-cap Technology. Despite ongoing hawkish rhetoric from Federal Reserve Chairman Jerome Powell and other central bankers around the globe, the S&P500 continued its march higher and ended the quarter up 8.29% (15.75% YTD). For the first two months of Q2 the market was extremely “narrow” with seven names (Apple, Microsoft, Amazon, NVIDIA, Alphabet, Meta, and Tesla) accounting for the bulk of the performance due to their overweighting in the market cap weighted index. Under the surface, other areas were decidedly weaker. If one were to look at the equal-weighted S&P500 (same companies, only equally weighted) it would tell a slightly different story. For the first quarter, the cap-weighted S&P500 was up over 7% while the equally weighted S&P500 was up only 2.9%. That trend continued into the second quarter with the S&P500 up 8.29% and the equal weighted S&P500 up 3.92%. Historically, extremely narrow markets have been a precursor to market weakness. That may or may not be the case this time around since we are coming off a bear market just last year but, nevertheless, this condition must change for this bull market to last. Current market action is not necessarily a harbinger of doom, it could be that Technology cools off a bit and the rest of the market catches up, In fact, that is exactly what we saw as the second quarter ended. For the month of June, the S&P500 was up 6.47% and the equal-weighted S&P500 was up 7.65%. Albeit early, this is an encouraging sign and has prompted our market strategists to raise the lower end of the potential range to 4,000 from 3,800. As we wrote last quarter:
Our expectation is for inflation to continue its downward trajectory and that we are much closer to the end of the rate hiking cycle than we were at the beginning of March. Our market strategists’ expectations are for a continued range-bound market (S&P500 3,700-4,200). It is likely in the short run that we don’t see much market upside but not that much downside either. From a Relative Strength standpoint, many of last year’s Relative Strength laggards rallied to begin the year. It’s too early to tell if this is the beginning of a new trend or just reversion to the mean.
Not much has changed in terms of our inflation expectations and our forecast for an upcoming recession later this year but the improved market breadth has given us confidence that we are unlikely to revisit the market lows from last October. In our Relative Strength analysis we continue to see strength in areas that are economically sensitive like Industrials and Materials. As always, we value your continued trust in us and are happy to answer any questions.
Did You Know – The Lag Affect
The Federal Reserve has embarked on its most aggressive rate hiking cycle in history over the last year and a half. Just like most economic data, monetary policy has a lag to it. However, it does appear that its effects are finally showing up in the economic data. While it’s finally showing up in the economic data, the lagging nature of the data likely means that these trends have been in place for at least a few months before they start to show up. For example, much of the data that shows a massive slowdown in lending came out from the Senior Loan Office Opinion Survey (SLOOS), which is published on a quarterly basis so there’s quite a bit of time between data points. Nonetheless, the recent SLOOS data shows that the Fed’s rate-hiking policy has been felt by both lenders and borrowers.
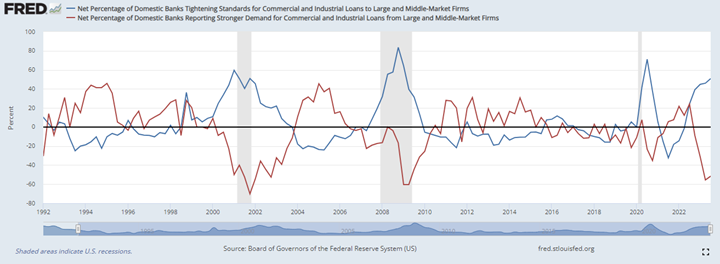
Lenders have tightened standards to concerning levels while demand for loans has materially weakened. In the chart below, the Net Percentage of Domestic Banks Tightening Lending Standards for Commercial and Industrial Loans to Large and Middle-Market Firms along with the Net Percentage of Domestic Banks Reporting Stronger Demand for Commercial and Industrial Loans to Large and Middle-Market Firms is displayed. The percentage of banks tightening is above 50% while the percentage of banks reporting strong demand for loans is -50%, both showing that banks are becoming less likely to lend while borrowers are less likely to borrow. Both readings are at or near historical extremes seen usually before or during a recession. This should be taken with a grain of salt given the Fed’s policy, but part of the intended effects of the rate hikes was to slow down the economy by slowing down lending. In this goal, it appears that the Fed has accomplished what it set out to do, however, the implications are yet to be known.
The previous data set covered business lending, but there are similar trends in the consumer credit market as well. The Net Percentage of Domestic Banks Tightening Standards for Credit Card Loans is at its highest level since 2020 and before that 2008-2009. While not part of the SLOOS data set and not as up to date, the Delinquency Rate on Credit Card Loans was last shown to be at normal levels. However, historically the two data points have moved together so it would not be surprising to see delinquency rates tick higher and reach the highest level in a decade. Based on the data sets observed so far, banks really began tightening their lending standards in the second half of 2022 and have continued to do so through 2023. Given their actions, banks are likely forecasting some type of economic slowdown, or else they wouldn’t tighten their lending standards. Whether or not they’ll be proven right remains unknown, but it’s good to know where they stand.
The foregoing information has been obtained from sources considered to be reliable, but we do not guarantee that it is accurate or complete, it is not a statement of all available data necessary for making an investment decision, and it does not constitute a recommendation. Any opinions are those of the author and not necessarily those of Raymond James. Expressions of opinion are as of this date and are subject to change without notice. There is no guarantee that these statements, opinions or forecasts provided herein will prove to be correct. Investing involves risk and you may incur a profit or loss regardless of strategy selected. Diversification and asset allocation does not ensure a profit or protect against a loss. Holding investments for the long term does not ensure a profitable outcome. US Treasury securities are guaranteed by the US government and, if held to maturity, generally offer a fixed rate of return and guaranteed principal value. The S&P 500 is an unmanaged index of 500 widely held stocks that is generally considered representative of the U.S. stock market. Inclusion of this index is for illustrative purposes only. Keep in mind that individuals cannot invest directly in any index, and index performance does not include transactions costs or other fees, which will affect actual investment performance. Past performance does not guarantee future results.