
Risk Class/Category Asset Allocation
Our in-depth analysis and study of the attributes of asset allocation evolved in the early 1990’s when computer software became available that allowed the application of mathematical principles without having to have access to a large database normally associated with large universities such as the University of Chicago. While many of these programs were marketed to advisors for the purpose of generating sales presentations illustrating the benefits of asset allocation we dug deeper so as to understand the mathematical relationships of the process.
Different asset classes, types of securities, capitalizations, and investment styles demonstrate different characteristics for risk and return. This in turn generated a track for us to implement attribution analysis for client accounts, securities, investment styles, mutual funds and portfolio managers. We had already learned that risk management was a critical part of portfolio management and portfolio design. The down cycle in the US equity markets that began in 2000 highlighted the suitability of this observation.
With this belief system in place and a decade of attribution analysis we were able to add an additional level to our process and our hurricane analogy was formed and has become an additional level of thought and analysis to our portfolio design process.
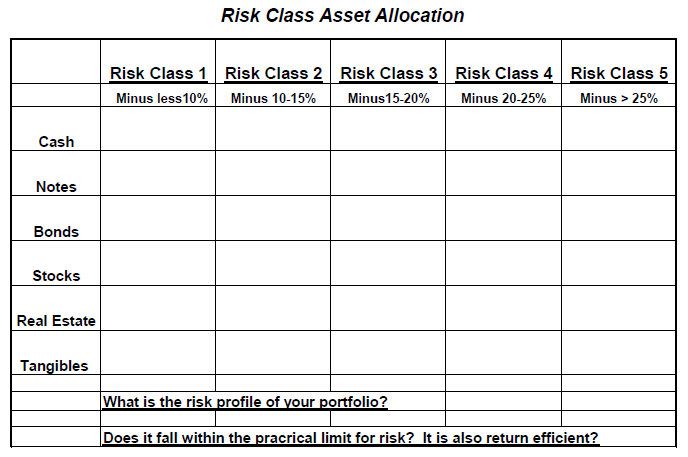
We simply consider each asset within a portfolio and assign it a risk classification based upon how much downside it has experienced in past financial storms or what we would expect it to experience in the next financial storm. Just like hurricanes we rank them from risk Category 1 to 5. In this process we classify anything that we think could decline less than 10% as a Category 1. A risk Category 5 could have a downside greater than 25%. Just like hurricanes a risk Category 5 asset will experience a lot of damage in a financial storm, a Category 1 not so much. While the mathematical analysis of finance is helpful it has not been able to account for the extreme cycles we can experience in a real world circumstance. The 2008 financial crisis is a recent example.
To put this in perspective, we consider almost all stocks are risk Category 5. The principle in risk efficient portfolio design is to identify and include those investments of lower risk categories that can still provide potential for equity like returns.
The purpose of this additional level of thought and analysis is to design portfolios that combine assets, styles and managers in fall within a risk category 3-4. This risk level projects a portfolio to be within our designated practical limit of risk and still provide for the opportunity to generate an after tax rate of return greater than inflation. The goal is to be both risk efficient and return efficient. This coincides with our experience and observation that if you do not take enough risk you cannot make your necessary returns (after tax return greater than inflation) and if you take too much risk you probably will not make your necessary returns. The latter is accurate because your results during a financial storm exceed the practical limit of risk and the time to make up the declines reduces your time to make the necessary returns.
