September 2023 Client Letter
September 10, 2023
Letter to Clients
So, How Am I Doing?
In many ways, 2023 has been a surprising year in the markets. The much-anticipated U.S. recession has not arrived. Inflation continues albeit with a declining rate of change. Polls emphasize a negative national mood despite low unemployment and solid GDP. The Fed has continued to raise interest rates and stocks have done pretty well, if not uniformly so.
As of this date, there is wide dispersion in the performance of various market indices. To illustrate, we use the year-to- date total returns of ETFs, that are "investable" versions of certain benchmarks, for the following data1:
In stocks there is notable dispersion between growth indices (e .g., QQQ) and value-oriented ETFs such as VTV (2 .92%), and also multi-billion dollar dividend strategies expressed, for example, in DIVO (2 .74%), JEPI (7.12%) and NOBL (4.26%).
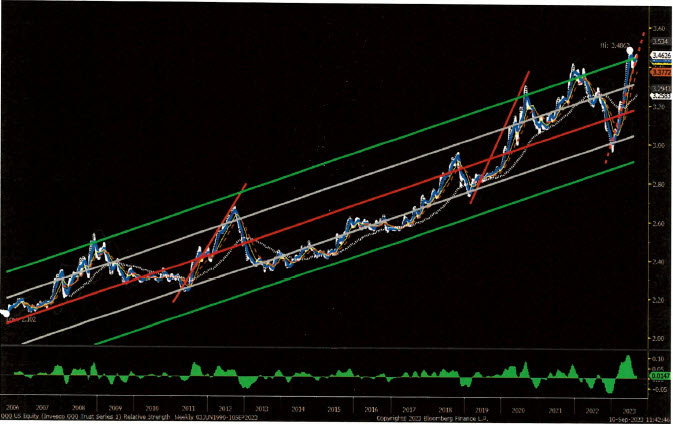
It has been, to date, a year in which returns are concentrated to a significant degree in the largest companies. The Vanguard Mega Cap ETF (MGK) is up 38.97%. The "cap-weighted" Nasdaq 100 (QQQ), at plus 40.33% stands in contrast to the equal weighted Nasdaq 100 (QQEW) which is up "only" 21.60%, that year-to-date performance difference being notably wide. Exhibit 1 shows the price ratio relationship between QQQ and QQEW. The top securities in the index have had a "relative strength" advantage throughout the period shown, with a tendency toward mean reversion after periods of strong outperformance.
EXHIBIT 1: Ratio of QQQ:QQEW2
Chess & Investing
We have frequently talked about the many possible moves in chess. With just two players, each starting with sixteen pieces, there are at first 20 possible moves for white and after one full turn, 400 possible moves. After just seven full turns, there are 3.2 billion possible moves!
Investors, unlike chess players, can choose to assemble their portfolios from millions of securities and derivatives. They play the game simultaneously with millions of other players, each playing at the same time, with different sets of "pieces", with widely varying amounts of money, and each playing with a different time clock. Many players play more than one "board" at a time. Clearly, we are talking about a very complex game.
Given that 2023 is characterized by a wide dispersion of returns based on asset class, market cap and other factors, let us now consider some simple examples of how market dynamics and portfolio construction might affect portfolio returns and the extent to which it matters.
We first consider the total return from December 31, 2022 through September 10, 2023 (dividends reinvested in each security/no rebalancing) for a hypothetical portfolio of 5 stocks [ Apple (AAPL); Verizon (VZ); General Electric (GE); Chevron (CVX); and CVS (CVS) ].
If we weighted each security equally [20% in each] our "portfolio" would be up approximately 13.53% through September 10.
If we tilted the portfolio to emphasize dividends [ 30% VZ; 25% CVS; 25% CVX; 10% GE; 10% AAPL] our portfolio would be fractionally down on the year ( -0.12%).
If we weighted the portfolio approximately by market cap, our portfolio would be up approximately 32.46% through September 10.3
Here we see that position-sizing alone can produce significant, even critical variations in returns4. If we added some form of re-balancing protocol to each of these portfolio mixes, we would have many additional return profiles5. Just these five securities could be mixed and matched in various weights, with various rebalancing schemes to produce an almost infinite array of return and risk characteristics.
We might also consider the impact of holding period on our performance experience. Suppose one bought a few shares of Disney as a birthday gift way back in October of 1990. The shares would now, with dividends reinvested, be worth about $13.14 for each dollar invested ........... an annualized return of 8.412%.6 Not bad, one might think. But if I had purchased the same gift on June 9, 2014 the return to September 10, 2023 would be 0.3899% annualized! And if I had purchased the same gift on March 2, 2021, the return would be -29.08% annualized! So ................ "how we are doing" is also very dependent on our look-back period!
When we ask the quite reasonable question of "How Am I Doing?", it opens up a whole can of worms! Relative to What? Over what period of time? Did we have a re-balancing methodology? What was our position-sizing methodology? Did those methodologies help us or hurt us, or did they add value in the context of our specific investment objectives? And so on and so forth.
Perhaps, the "transformational change" is for us to re-think the way that we benchmark our portfolios. Can we benchmark in a way that's more relevant to our specific objectives and time horizons? Can we benchmark in a way that separates our desired results from the serendipity of markets over what may be relatively long periods of time? Can we deliver reports that capture this highly customized information? And if we do that well, can we derive better outcomes?
More to follow ....................................................
Fred
1Source: Bloomberg, L.P. All data herein is obtained from sources believed to be accurate and reliable, but no guarantee is made, either express or implied, as to the accuracy of the data herein. Data is presented for discussion purposes only. Returns are not representative of any specific portfolio or strategy. Past performance is not indicative of or a guarantee of future results. Nothing herein is intended as a guarantee, either express or implied, that any investment strategy may be executed as intended due to market conditions or other conditions. Nothing herein constitutes a guarantee that profits will be made or that losses will not be incurred. Nothing herein constitutes an offer to sell securities, or a solicitation of an offer to buy securities
2Chart Courtesy of Bloomberg, LP
3Hypothetical portfolio data using total return data from Bloomberg, LP. The data herein does not represent any actual portfolio and is not representative of any actual returns. The data is constructed for discussion and illustrative purposes only.
4See, Ralph Vince; The Leverage Space Trading Model: Reconciling Portfolio Management Strategies and Economic Theory: Wiley Trading; c 2009;
and also, Ralph Vince; Risk-Opportunity Analysis; Create Space; February 2012
5The literature on rebalancing is huge. A couple of examples follow, including lsraelov on using options to bring efficiency to the matter of portfolio rebalancing. Skallsjo, Sven R.; Simple Formulas for Portfolio Rebalancing Rules; 10 Feb 2019; https://papers.ssrn .com/sol3/papers.cfm?abstract id=3331894 also: Michael Edesess; Rebalancing: A Comprehensive Reassessment; November 2017 https://papers.ssrn.com/sol3/papers.cfm ?abstract id-3075023 and lsraelov, Roni and Harsha Tummula; An Alternative to Portfolio Rebalancing; October 2017; https://papers.ssrn.com/sol3/papers.cfm ?abstract_id=3061975
6Source: Bloomberg, LP
