July 4th Letter
Whether your weekend is marked by fireworks, baseball, barbeques and picnics, family reunion, travel, or service, we hope that your 4th of July is safe, healthy and happy. As we begin the third quarter of 2022, we might also wish that fireworks be thought of as a patriotic celebration rather than a regular capital markets event, but we shall take what comes with confidence in the future and the enterprising spirit that is commemorated on the 4th.

As you know, our home base is Rhode Island, so we can say with a sense of pride that the 4th of July Parade in Bristol, Rhode Island has been held since 1785 and is the oldest continuous Independence Day celebration in the United States. This year, the parade may include a modern twist as videographers attempt to document “votes” in support of a declaration that the first shots of the American Revolution were not fired at the North Bridge in Concord, Massachusetts but, in fact, occurred years earlier during an attack on the HMS Gaspee, in Rhode Island’s Narragansett Bay. The Gaspee was a British revenue schooner that had run aground on June 9, 1772, at what is now known as Gaspee Point, while chasing the packet ship Hannah in upper Narragansett Bay. Before the tide permitted re-floating of the Gaspee, the schooner was stormed at the crack of dawn on June 10, 1772 by the Sons of Liberty. In the ensuing attack, the British commander was shot and the Gaspee was burned to the water line. You may search online for much more information about this event and the fascinating history of the American Revolution.
To be somewhat “neutral” in this historical “dispute”, the photo of the American Flag[1] is from Mt. Rubidoux in Riverside, California. Happy 4th of July!!
THANK YOU
As we complete the first two quarters of this year, the first order of business is to say “THANK YOU” again to the valued clients who have continued to entrust us with the privilege and responsibilities of supervising their assets and furnishing financial guidance. We take our responsibilities seriously and work diligently on your behalf every day. We fully appreciate the opportunity to be at your service.
As we have settled in at Raymond James, it has been a busy six months and the markets have been somewhat turbulent. Many of you have visited the office already and we hope to welcome more of you in the near future. Our team, and one other team, have “planted the flag” for Raymond James & Associates, Inc. in Providence, and we expect to move into permanent space in the fall of this year.
You have all become acquainted with Sandra Santos who does “all things administrative” for us. She is always enthusiastic, reliable and competent. I am very happy that clients are feeling comfortable running basic questions, scheduling matters and other things through Sandra. Her working relationship with you is already helping me to have more focus on markets and to be efficient and effective on your behalf.
While Ryan Brassard is less visible to you, he has been, and continues to be, of enormous help in our service, administrative and compliance efforts on your behalf. We are also looking forward to building out the team further in the months ahead.
Please note that after July 1, we will begin to more regularly answer the phone with our “Synthesis Advisory” brand.
MORE TO FOLLOW……
During our transition to Raymond James, we have been working to integrate what we do for you with the firms’ systems. We have thought carefully about how to best serve our existing and prospective clientele, how to gain the most on your behalf from the very important new capabilities at our disposal, and how to build an operational protocol that is robust in all market conditions and seamlessly expandable as we create and deliver new strategic and tactical offerings to you and to new clients. Due to the unique nature of our approach to investment management, we have needed to build an account coding protocol and trading interfaces to adapt our processes to the Raymond James system. We have built screening data bases, market monitor packages, tracking systems, research and trading protocols and more. We have substantially completed that work, and over this long weekend I will re-code every account to reflect our up-to-date thinking on efficiency, scalability, and capacity for execution. These are “behind-the-scenes” operational aspects of how we work for you, but they are most assuredly critical and material to how effectively we act on your behalf.
Over the next quarter, we will be in touch with each of you to:
- Let you know about what is new and what it means to you;
- Review your financial and investment objectives and re-check the match to portfolio models, market conditions, risk tolerances, etc.
- Review your portfolio management strategies and tactics and make recommendations for strategic changes if necessary;
- Review the markets and our thoughts about how your may be affected portfolio going forward;
- Discuss improvement to our contact and communications protocol;
- Conduct a preliminary tax-management discussion;
- Fill you in on new capabilities to advise on certain of your 401k and other retirement plan assets;
- Receive your update on new developments, special needs or other thoughts about how we may help you;
- ……….More to Follow!
MARKETS[2]

Capital markets in 2022 to date have been turbulent to say the least. Bonds have had a sell-off of historical proportions. Equities are generally lower and by the measure of some indices, substantially lower. The U.S. Dollar has strengthened significantly and commodity prices have risen, although there have been some divergences of late. Inflation and geopolitical issues have taken center stage in strategic discussions. There are many supply chain issues yet to be worked out, and filling jobs continues to be a challenge. The issues facing market participants are complex and multi-faceted. Data is plentiful but clarity is not. So now, more than in recent memory, there are great variations in forecasts derived from substantially equal information. This is all a prescription for volatility. Turbulence on an airplane flight is primarily an aggravation. Volatility in the markets is certainly an aggravation, but may also present opportunities.
I have attached some charts for us to use in one-on-one discussions about the markets, your portfolios and portfolio management strategy. A Raymond James review of capital markets data, including year to date performance data for a wide range of indexes will be sent in a separate email.
S&P GOLDMAN SACHS NEARBY COMMODITIES INDEX
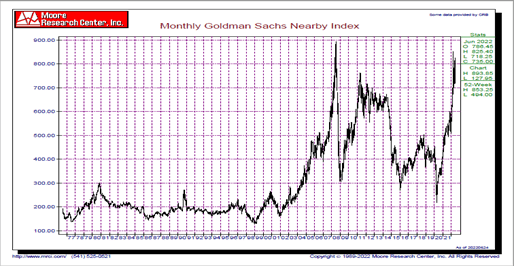 Chart Courtesy of Moore Research Center, Inc. http://www.mrci.com/ 541 525 0521
 While the charts are offered here substantially without comment, please note the presence of regular spikes in the index of commodity prices. Commodity price spikes are regularly followed by substantially price declines, usually in short order. This is where the disclaimer comes in: Past performance is not a guarantee of future results.
NYMEX 1st Month WTI CRUDE OIL FUTURES
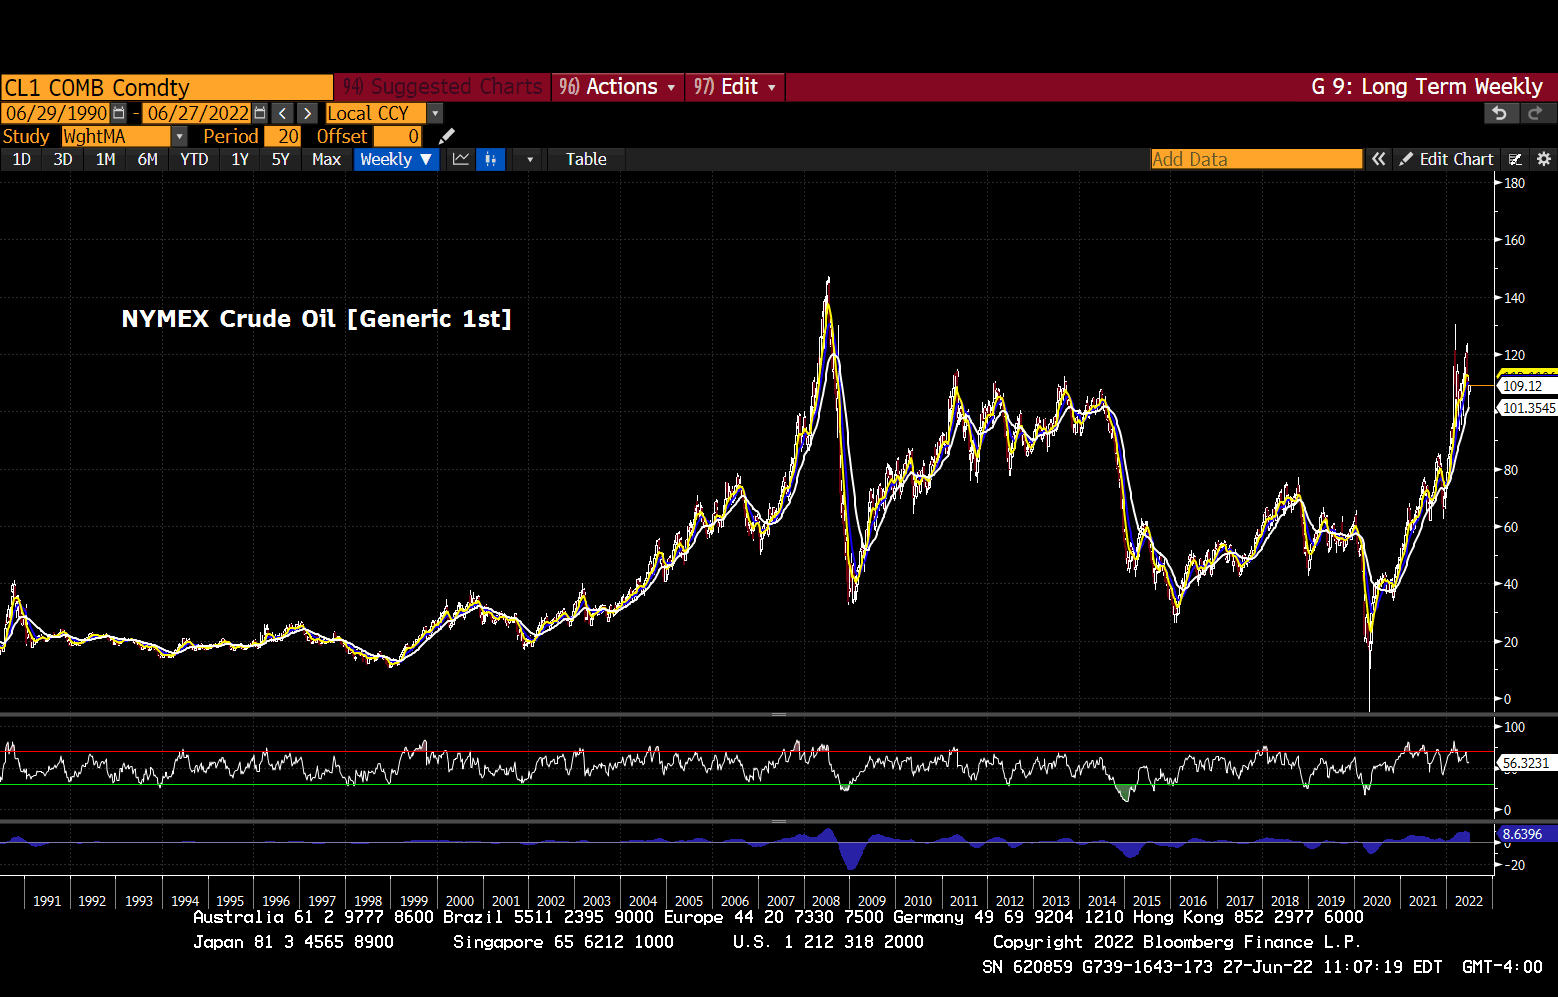 Chart Courtesy of Bloomberg Finance L.P. Used by Permission
Crude Oil Futures (above) are a significant component of most commodity price indices, and thus exhibit similar characteristics. While we watch nightly news stories about high crude prices and the price of a gallon of gasoline, it is worth noting (for many reasons, which we will discuss) that just over two years ago, Crude Futures traded briefly at -$37 per barrel. Yes! that is negative $37! Of perhaps more direct interest, is the chart of Unleaded Gasoline Futures (below).
NYMEX 1st Month RBOB FUTURES
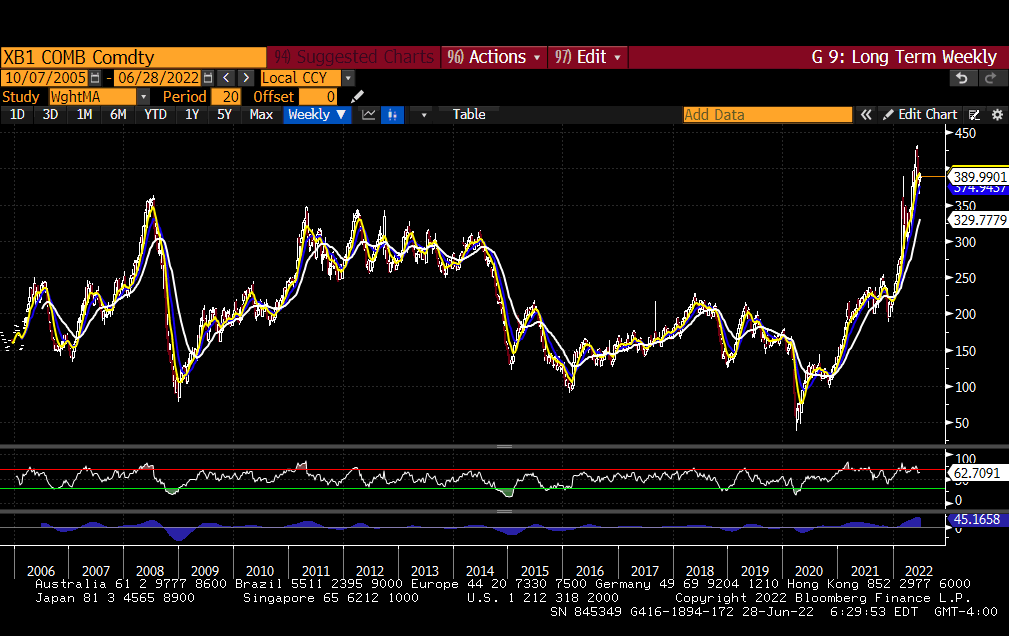 Chart Courtesy of Bloomberg Finance L.P. Used by Permission
INTEREST RATES AND INFLATION
The following two charts (next page) show interest rates and inflation assumptions reflected in the market place. The first chart shows an index of 10-Year U.S. Treasury Yields going back to 1993. Yields have risen sharply from Covid Crisis low levels, and have broken a long term downtrend. Higher yields from such low levels has wreaked havoc on bond prices. More discussion on this to follow.
The Second chart shows inflation assumptions that are priced into the market for five years, starting five years from now. You will see that the market is not “hysterical” about high inflation over the longer term. Whether that stance is warranted will be known in the fullness of time.
CBOE YIELD INDEX – U.S. 10 YEAR TREASURY NOTE
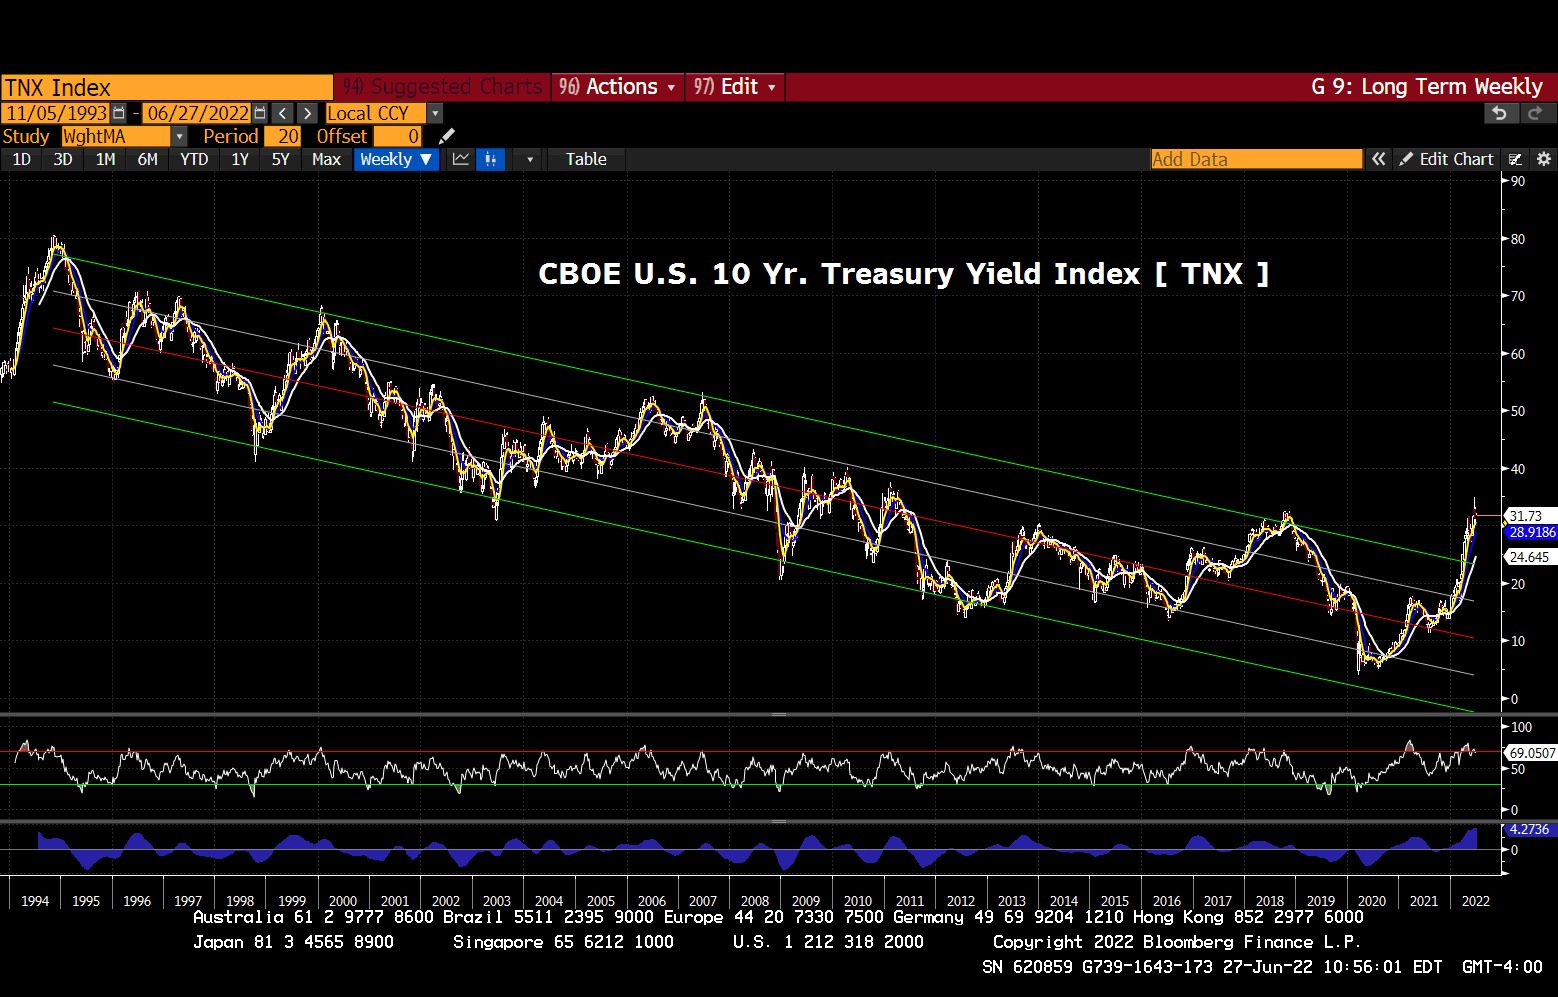 Chart Courtesy of Bloomberg Finance L.P. Used by Permission
U.S. 5Yr/5yr FORWARD BREAKEVENS
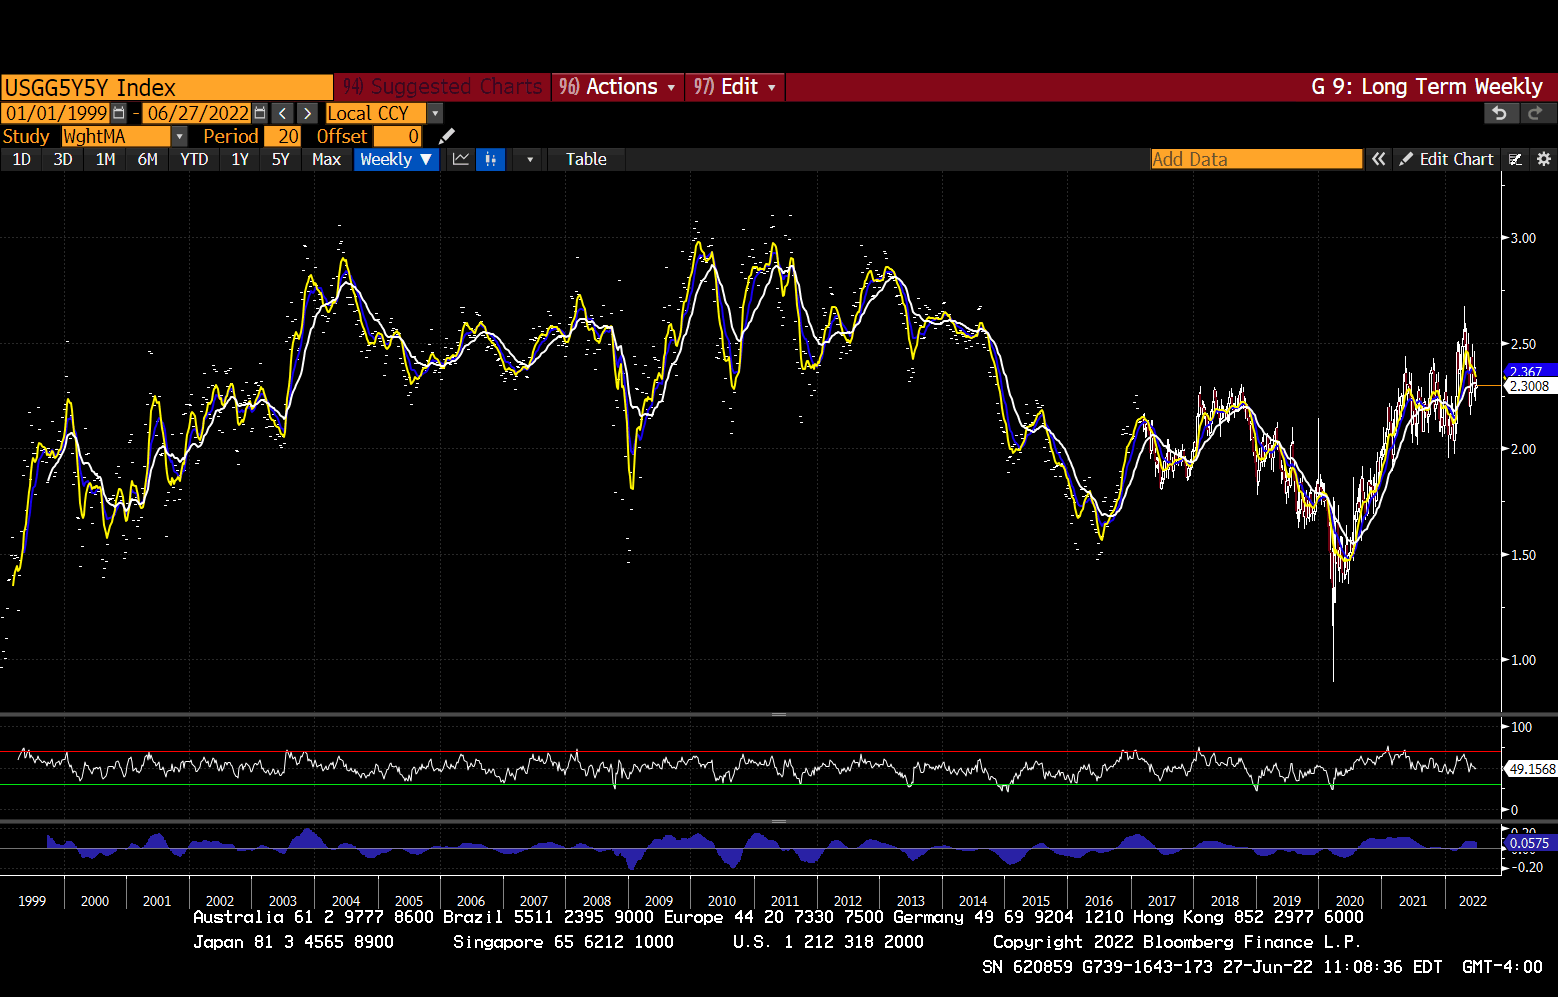 Chart Courtesy of Bloomberg Finance L.P. Used by Permission
GROWTH Vs. VALUE
Finally, we show a view of equity price relationships that reflect the move toward higher interest rates and possibly other factors. The chart below shows the relationship of large cap growth stocks as represented by the Nasdaq 100 Index (think Apple, MicroSoft, Amazon, Google, Facebook, Tesla, etc.) versus a large cap value index represented by the S&P Pure Value Index (think Berkshire Hathaway, JP Morgan, Johnson & Johnson, Procter & Gamble, etc.)
The growth names have begun to move back to trend, but not below trend (as yet).
NASDAQ 100 Index [NDX] vs S&P PURE VALUE Index [SPXPV]
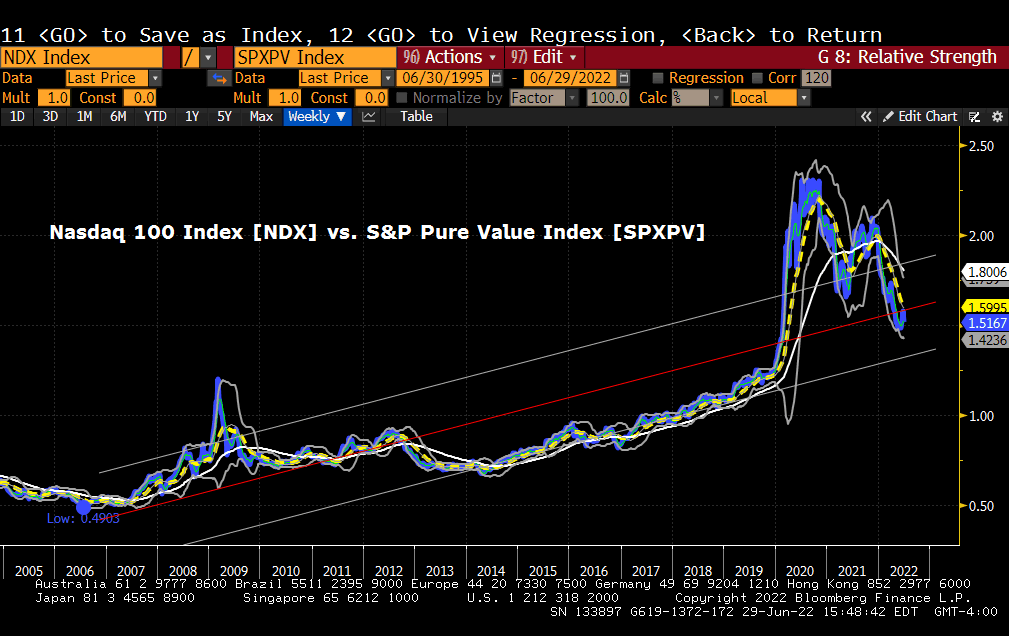 Chart Courtesy of Bloomberg Finance L.P. Used by Permission
We look forward to speaking soon. Again, Happy 4th of July !!
Frederick J. Rickey III
First V.P. Investments
IMPORTANT INFORMATION
The information herein has been obtained from sources considered to be reliable, but we do not guarantee that the foregoing material is accurate or complete. This material is being provided for information purposes only and is not a complete description, nor is it a recommendation. Expressions of opinion are as of this date and are subject to change without notice. There is no guarantee that any statements, opinions or forecasts provided herein will prove to be correct. Investing involves risk and investors may incur a profit or a loss. Past performance does not guarantee future results.
The S&P GSCI® is a composite index of commodity sector returns representing an unleveraged, long-only investment in commodity futures that is broadly diversified across the spectrum of commodities. The returns are calculated on a fully collateralized basis with full reinvestment. The combination of these attributes provides investors with a representative and realistic picture of realizable returns attainable in the commodities markets.
Individual components qualify for inclusion in the S&P GSCI® on the basis of liquidity and are weighted by their respective world production quantities. The principles behind the construction of the index are public and designed to allow easy and cost-efficient investment implementation. Possible means of implementation include the purchase of S&P GSCI® related instruments, such as the S&P GSCI® futures contract traded on the Chicago Mercantile Exchange (CME) or over-the-counter derivatives, or the direct purchase of the underlying futures contracts.
CL1 is an expiration-to-expiration rolling index of Crude Oil Prices. Crude oil is the world's most actively traded commodity, and the NYMEX Division light, sweet crude oil futures contract is the world's most liquid forum for crude oil trading, as well as the world's largest-volume futures contract trading on a physical commodity. Because of its excellent liquidity and price transparency, the contract is used as a principal international pricing benchmark. The contract trades in units of 1,000 barrels, and the delivery point is Cushing, Oklahoma, which is also accessible to the international spot markets via pipelines. The contract provides for delivery of several grades of domestic and internationally traded foreign crudes, and serves the diverse needs of the physical market. Light, sweet crudes are preferred by refiners because of their low sulfur content and relatively high yields of high-value products such as gasoline, diesel fuel, heating oil, and jet fuel.
XB1 is an expiration-to-expiration rolling index of Unleaded Gasoline Prices. Gasoline is the largest single volume refined product sold in the United States and accounts for almost half of national oil consumption. It is a highly diverse market, with hundreds of wholesale distributors and thousands of retail outlets, making it subject to intense competition and price volatility. The NYMEX Division New York harbor unleaded gasoline futures contract and reformulated gasoline blendstock for oxygen blending (RBOB) futures contract trade in units of 42,000 gallons (1,000 barrels). They are based on delivery at petroleum products terminals in the harbor, the major East Coast trading center for imports and domestic shipments from refineries in the New York harbor area or from the Gulf Coast refining centers. The unleaded gasoline contract specifications conform to those for oxygenated gasoline, required in many areas for controlling emissions that can adversely affect air quality. With the ongoing phaseout of the oxygenate methyl tertiary butyl ether (MTBE) the industry is shifting towards ethanol. RBOB conforms to industry standards for reformulated regular gasoline blendstock for blending with 10% denatured fuel ethanol (92% purity) as listed by the Colonial Pipeline for fungible F grade for sales in New York and New Jersey. RBOB is a wholesale non-oxygentated blendstock traded in the New York Harbor barge market that is ready for the addition of 10% ethanol at the truck rack. The RBOB gasoline futures contract, XBA
The Chicago Board Options Exchange 10-Year T-Note Index is based on the yield-to-maturity (YTM) of the most recently auctioned 10-yr T-note. The index is calculated by multiplying the T-note YTM by a factor of 10.
USGG5Y5Y is an index of U.S. 5-year, 5-year forward breakevens. The rates are comprised of Generic United States Breakeven forward rates: nominal forward 5 years minus US inflation-linked bonds forward 5 years.
The S&P Pure Value Index is a style concentrated index designed to track the performance of stocks that exhibit the strongest value characteristics by using a style-attractiveness-weighting scheme.
The Nasdaq-100 Index is a modified capitalization-weighted index of the 100 largest and most active non-financial domestic and international issues listed on the NASDAQ. No security can have more than a 24% weighting. The index was developed with a base value of 125 as of February 1, 1985. Prior to December 21, 1998 the Nasdaq-100 was a cap-weighted index.
Raymond James & Associates, Inc. member NYSE/SIPC
Charts used by permission of Bloomberg Finance, L.P. and Moore Research Center, Inc. http://www.mrci.com/ 541 525 0521
1 Photograph by: frworldview; frworldview@gmail.com
[2] Photograph by: frworldview; frworldview@gmail.com
