Playing the Percentages

To access this week’s video update please click here.
First quarter in the books. Can you believe it?! April 1st is always a reflection point for me, because it’s my eldest daughter’s birthday. Happy Birthday Emma!!!!! Yep, an April Fools Baby. I was the fool that day in 1997, when I received a call at 1 am that my wife’s water had broken, and I better get to the hospital. She was already two weeks late, so I drove to the hospital at warp speed, to subsequently wait 18 hours for her to be born. That’s where I phrased the expression “hurry up and wait”, and if you know my kid, that sums her up pretty well. I can pick on her in these articles because I know she doesn’t read them. Nor do any of my kids for that matter, which is why I’ll probably be doing this job forever, as I have no one to pass it to. Don’t worry she found her passion and is now a Police Officer in the Melbourne Police Department, (That’s Melbourne Florida-Not Australia), and I couldn’t be prouder of her.
Anyway, let’s talk numbers.
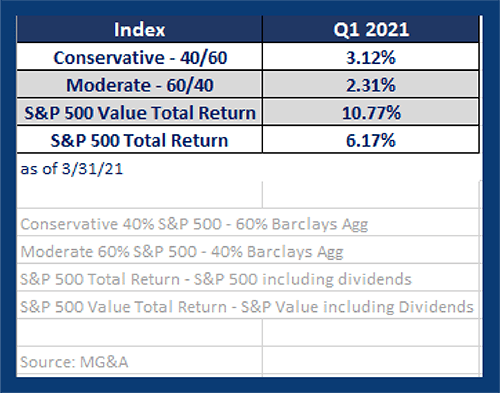
Here are returns for the 1st quarter 2021.
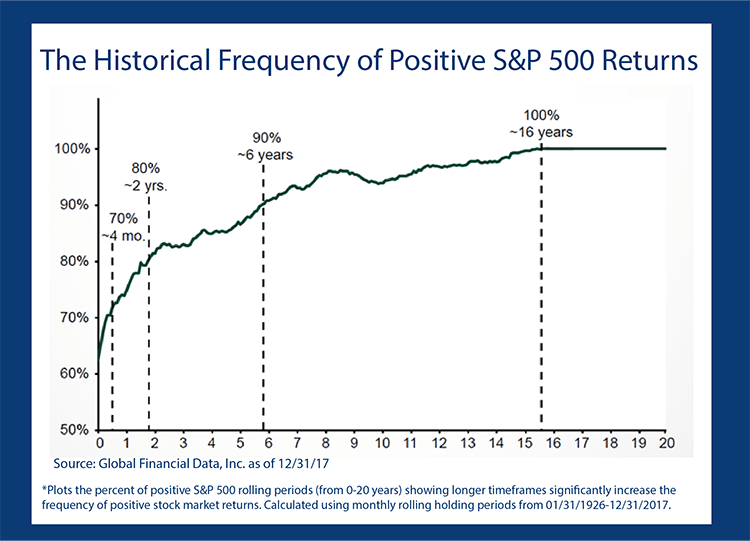
I’m always on the look out for areas of the market that historically have given high levels of success. Think about the 3rd year of a Presidential cycle (89% provide positive returns in the market – opposed to approx. 70% for all years). Look at the long-term chart below and see how 16 years has historically given you a 100% chance of getting a positive return in the stock market.
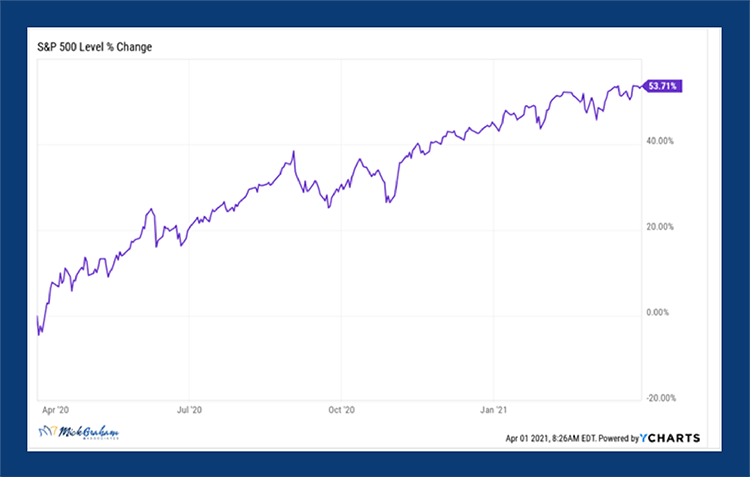
We are now at the time where I’m receiving questions about the length of this bull market, especially after a huge run in the rolling 12 months (S&P 500 up 53%), it would be logical to think that the next 12 months could be pretty dismal. Well, that’s not what the numbers tell us.
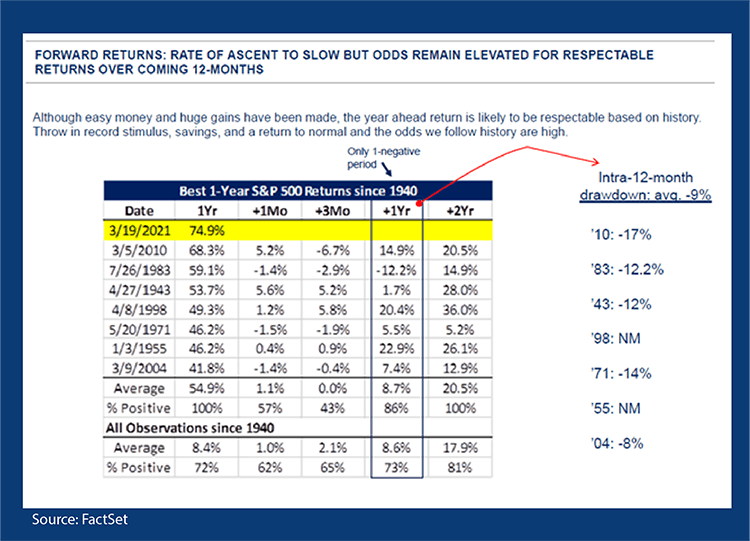
We ran an analysis on when the market has given us a 40% rolling 12 months return and looked at what the next 1 month, 3 months, 12 & 24 months gave us. What came out of it was a really high percentage on the 12-month number (86% positive, with an average 8.7% return), and 24-month (100% positive, averaging a 20.5% return). These stats always get my attention.
What it also tells us is the shorter term 1-3 months, are a coin toss on whether they are positive or not. This would fall right into what we are seeing now, which I believe is some consolidation, especially in the larger cap names, which as I’ve mentioned before have a bigger influence on the major indexes. Just as a reminder, the S&P 500 is a market weighted index, meaning the larger companies get a bigger weighting, and as such have more influence on the return of the overall index.
Recently the decline in the tech sector (which makes up 26% of the S&P 500 – and houses some of the biggest companies), have taken away from the sectors that have done very well recently like financials and energy. I remember when energy companies and banks held the top positions in the S&P 500. Now you’d have to go down to the 8th position to get a financial company. I believe this rotation is real.
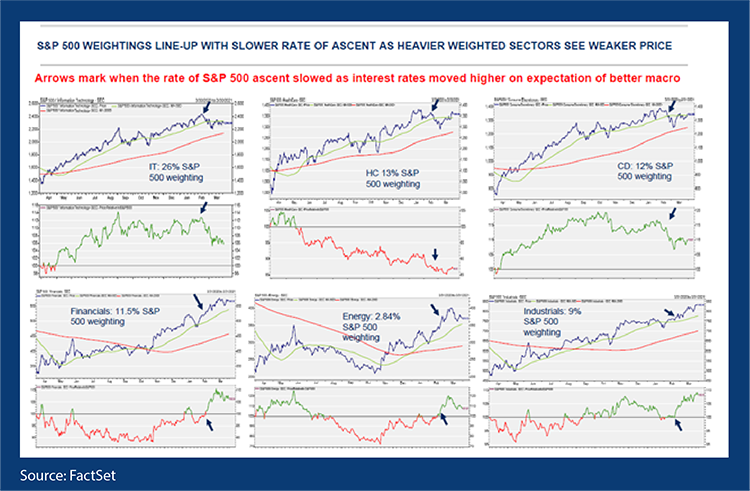
So, what from here? Earnings! This is where the rubber hits the road, and I’ll be paying special attention to the earnings of those tech companies. Is the recent decline justified, or is it overdone? We will start to get a sense of how CEO’s feel about the economy and what investments they are making for future profits.
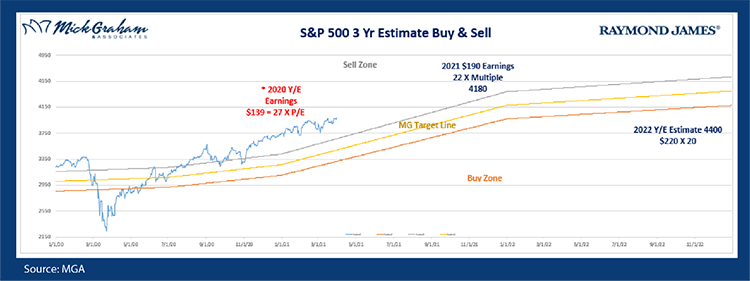
With all that said, here’s the buy/sell.
The information contained in this report does not purport to be a complete description of the securities, markets, or developments referred to in this material. The information has been obtained from sources considered to be reliable, but we do not guarantee that the foregoing material is accurate or complete. Any opinions are those of Mick Graham and not necessarily those of Raymond James. Expressions of opinion are as of this date and are subject to change without notice. There is no guarantee that these statements, opinions or forecasts provided herein will prove to be correct. Investing involves risk and you may incur a profit or loss regardless of strategy selected. Keep in mind that individuals cannot invest directly in any index, and index performance does not include transaction costs or other fees, which will affect actual investment performance. Individual investor's results will vary. Past performance does not guarantee future results. Future investment performance cannot be guaranteed, investment yields will fluctuate with market conditions.

