What Took You So Long?

To watch/listen to this week’s shortened article recap please click here.
I finally updated the Buy/Sell this week. For the past month or so the current market has literally been “off the chart”. I wish I could tell you the reason I haven’t updated it is due to my hectic vacation schedule, but like you, I’ve been doing the same thing each day while we anxiously wait for life to return to normal. Well, as normal as it can be.
Estimating where an index will be at any particular period of time is a fool’s errand at any stage, and is total insanity in times like this, but I’ve never let that stop me before, if for no other reason than I resemble those remarks. My fair value for the S&P 500 at year end is now 4180, which provides nearly 8% from where it closed on Wednesday.
The real reason I’ve taken so long to update this estimate, is that I’ve been waiting for the 2020 Earnings number to get reported. Remember, most companies report their 4th Quarter numbers sometime in the 1st quarter of the following year. There are still a couple of companies that still need to report, however, I’m pretty confident earnings for 2020 are right around $139 (a 15% decline from 2019). The Covid closure and subsequent rebound in earnings has created the most widespread demise of earnings I’ve seen. The ‘08 financial crisis was mainly detrimental to financial company earnings, and the tech crisis did not have as big of an effect on earnings, due to most of the ramp up in stock price at that time was focused on tech companies that didn’t have any earnings anyway. This time was truly different.
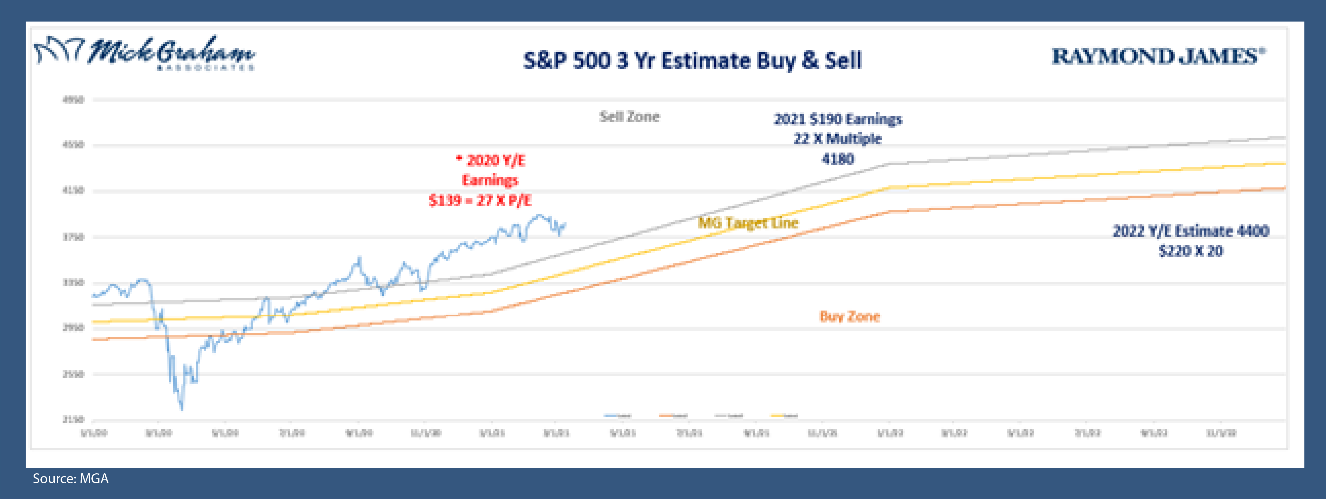
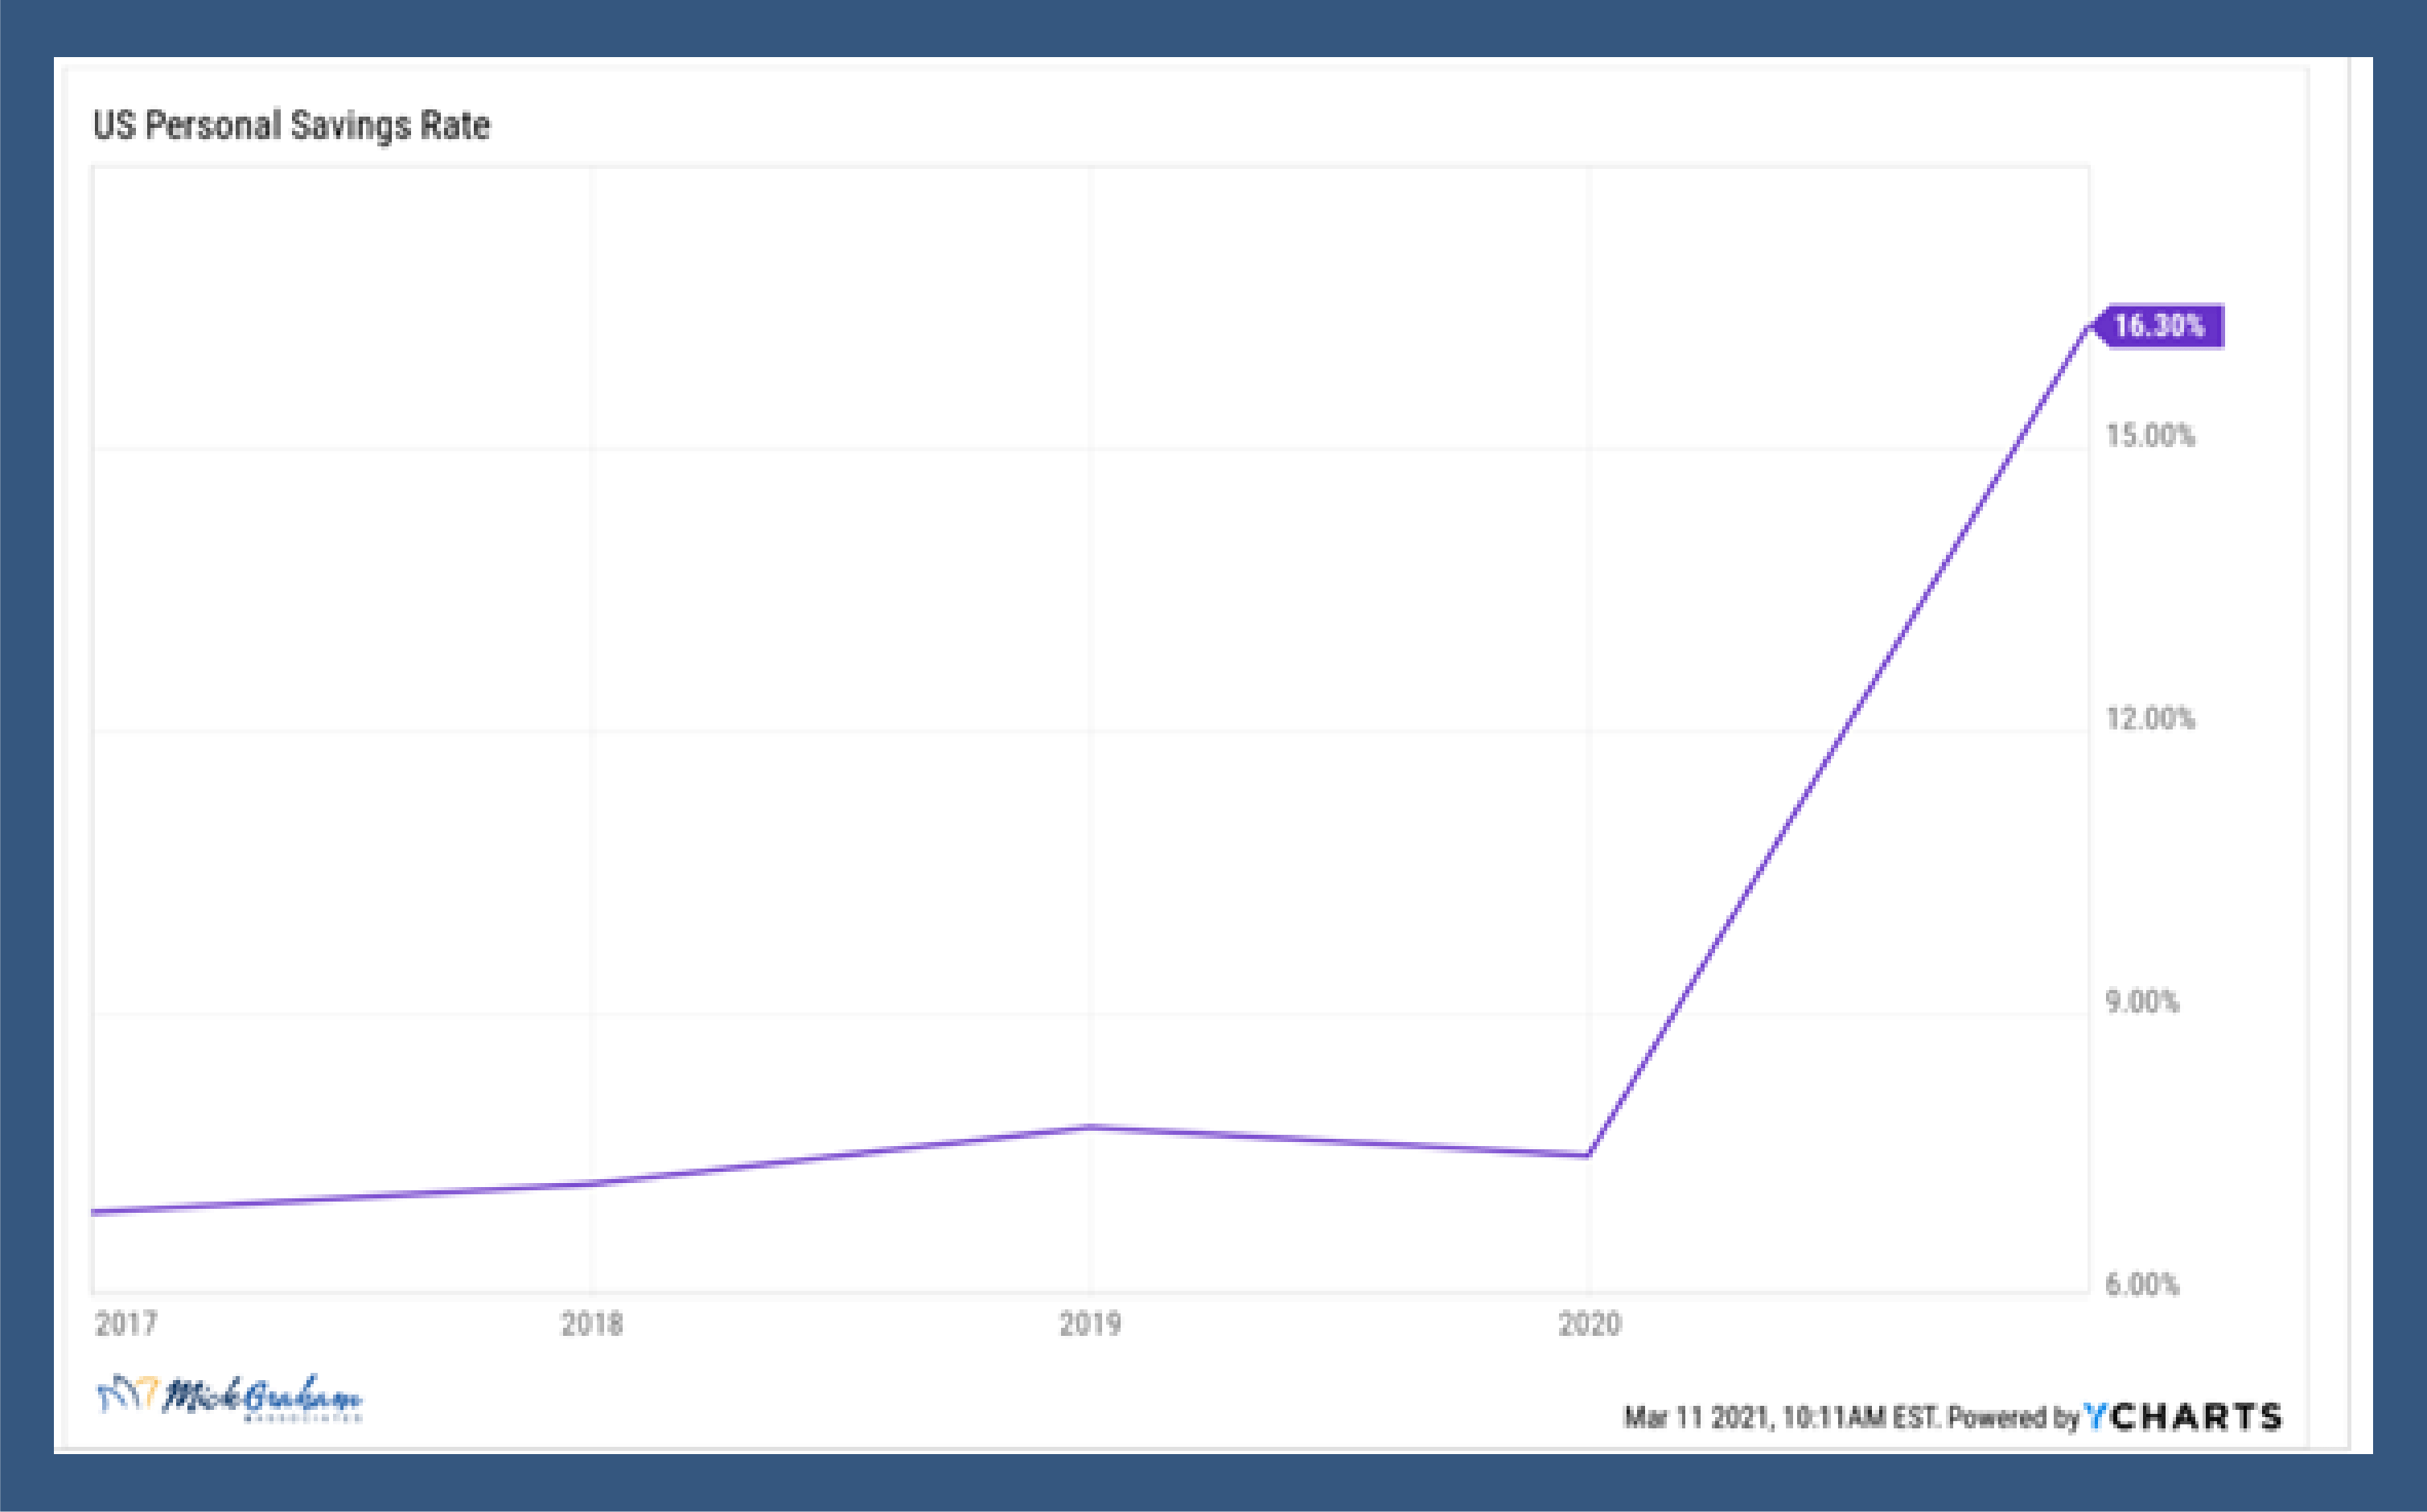
For 2021 I’m estimating earnings to come in around $190 as vaccine rollouts continues to ramp up, the U.S. personal savings rate is at highs not seen since the 40s, (providing plenty of pent-up demand), unprecedented stimulus, and low rates, which all provide massive liquidity in the markets. To get 4180, I have put 22 times multiple, which although is still higher than historical averages, fits the times we live in. 2020 looks like it’s coming in around 27 times earnings, and we no doubt need to contract that number back to normal (which is right around 20), however, I feel this may take some time to play out (end of 2022).
My earnings estimate for 2022 is now $220 which would take the S&P 500 to 4400 around 14% from here. A below average stock market return for two years, but still better than most other asset classes.
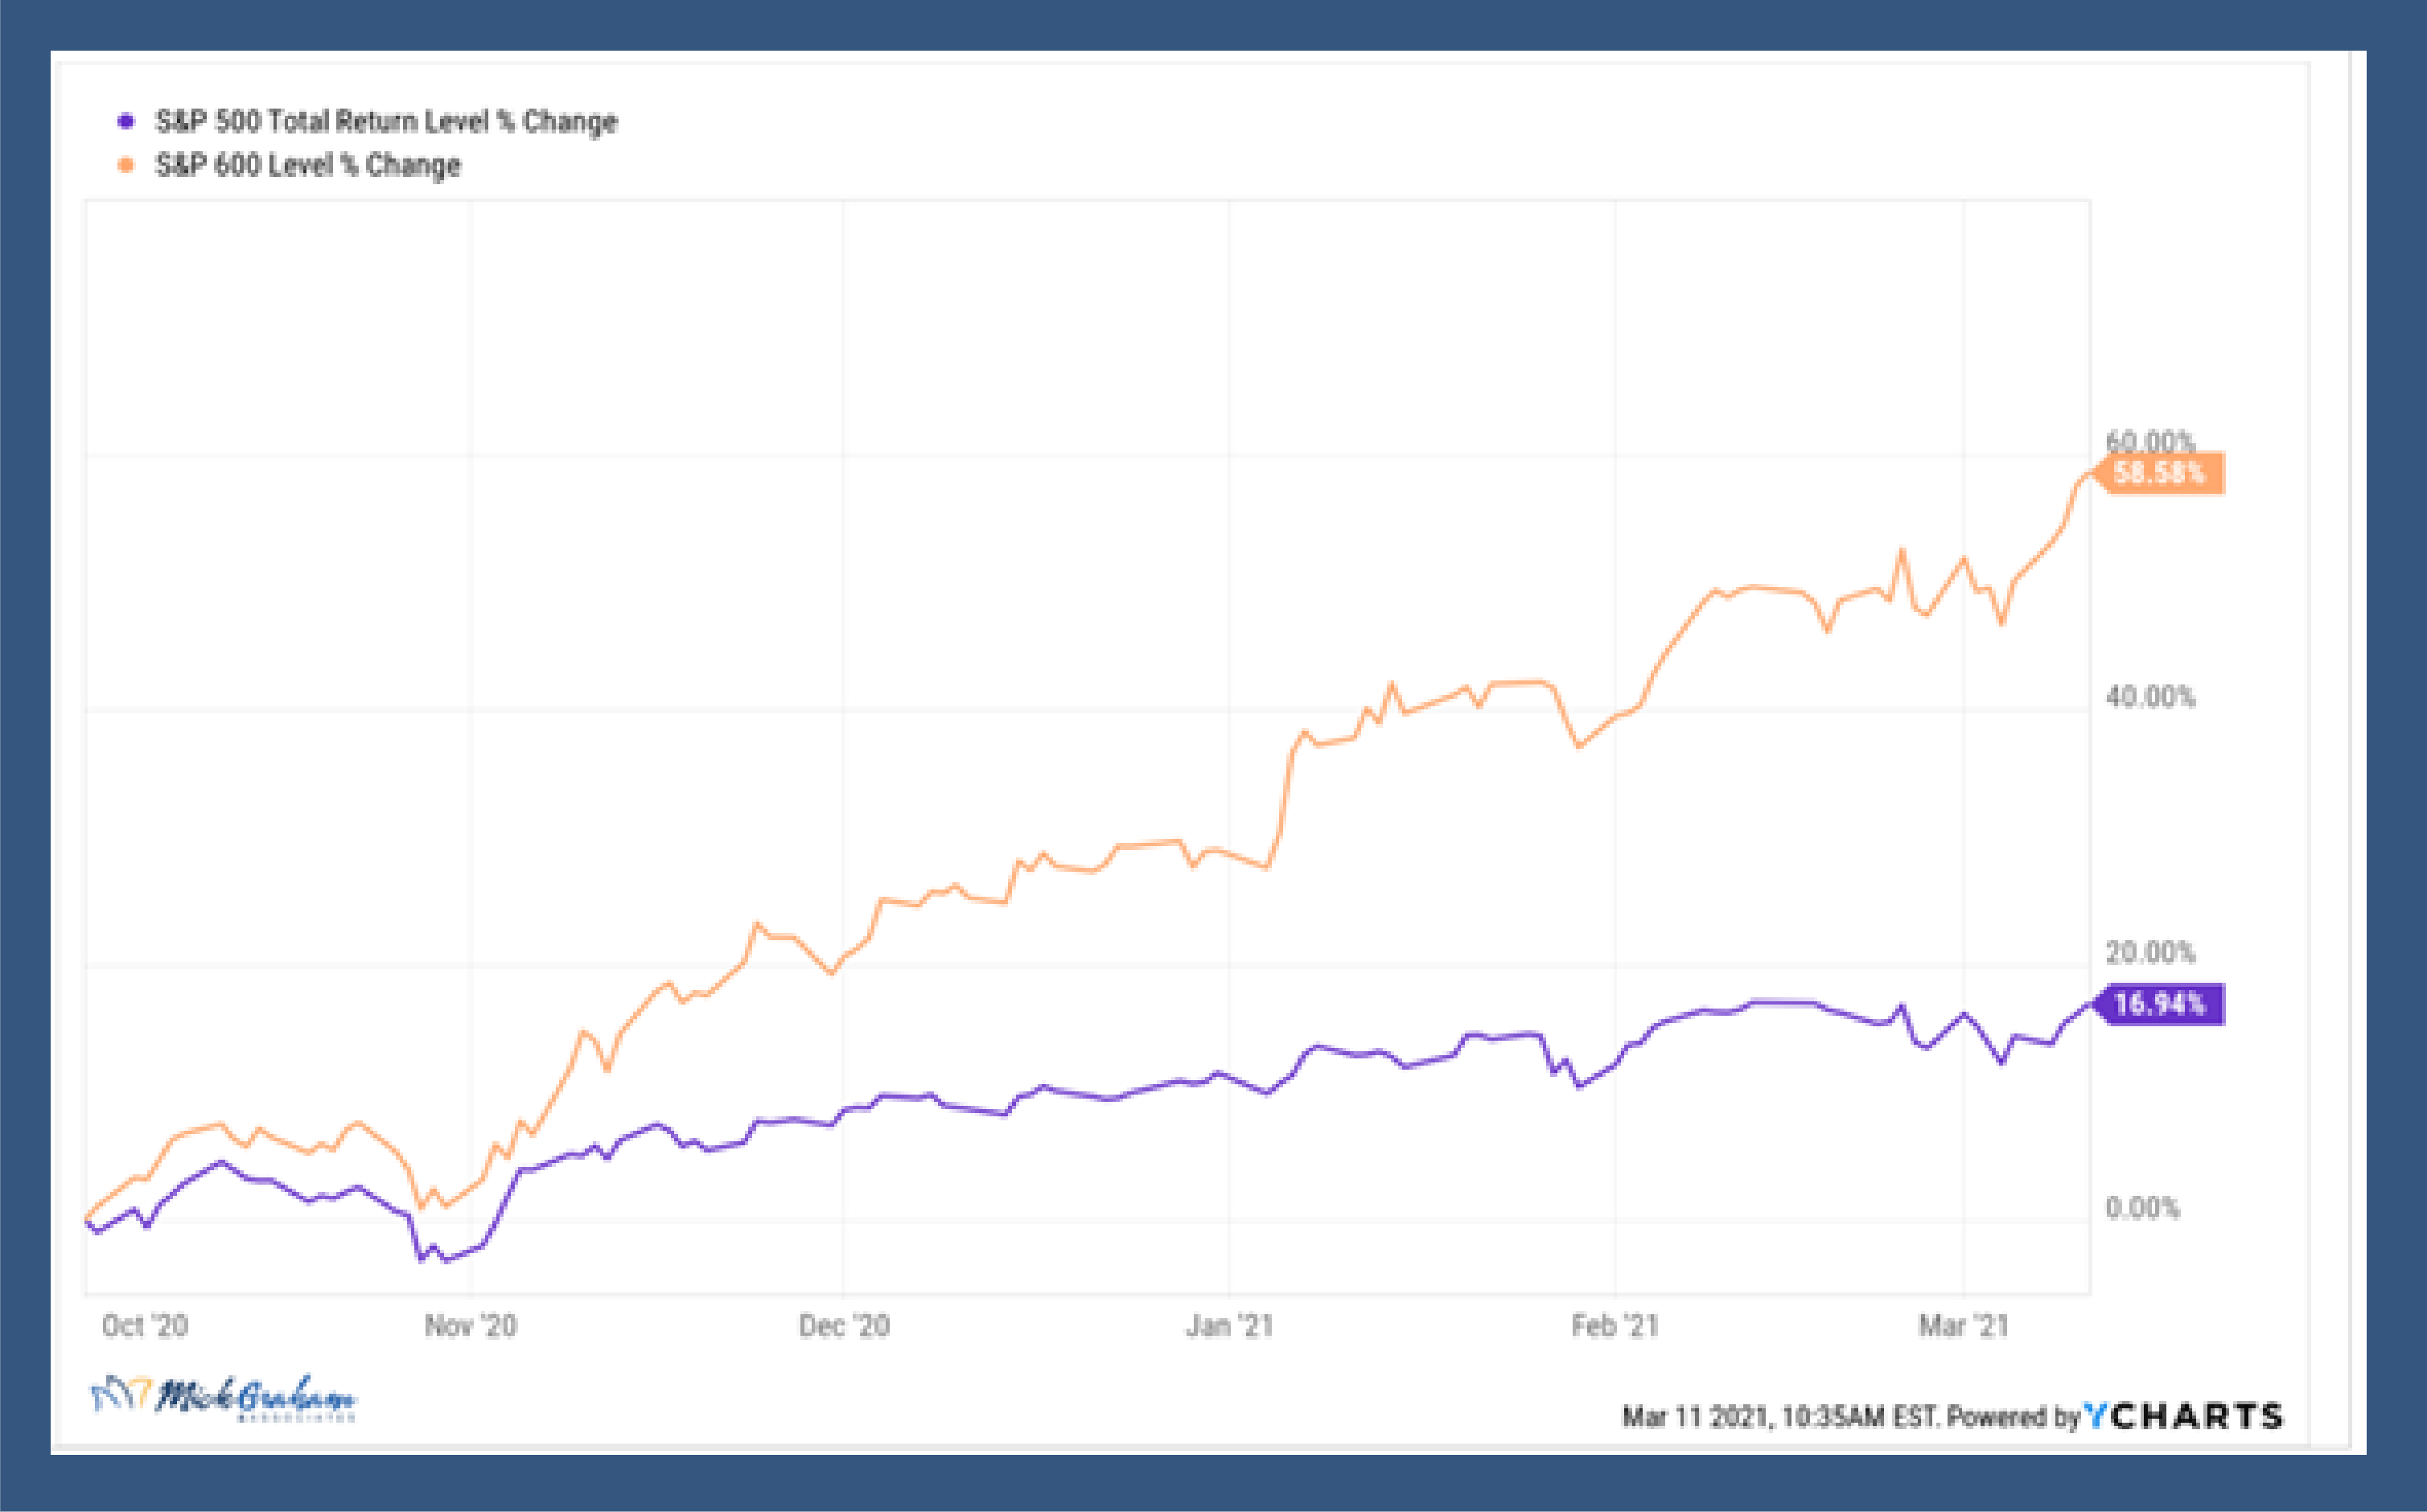
I do feel the rotation has started from large to small, as easy money tends to assist smaller companies who usually struggle to get capital. The rotation started around October of last year and has happened at breakneck speed. If you think you’ve missed it though, you only need to look at the longer-term chart which still has small caps lagging. The scene is set now for small caps.
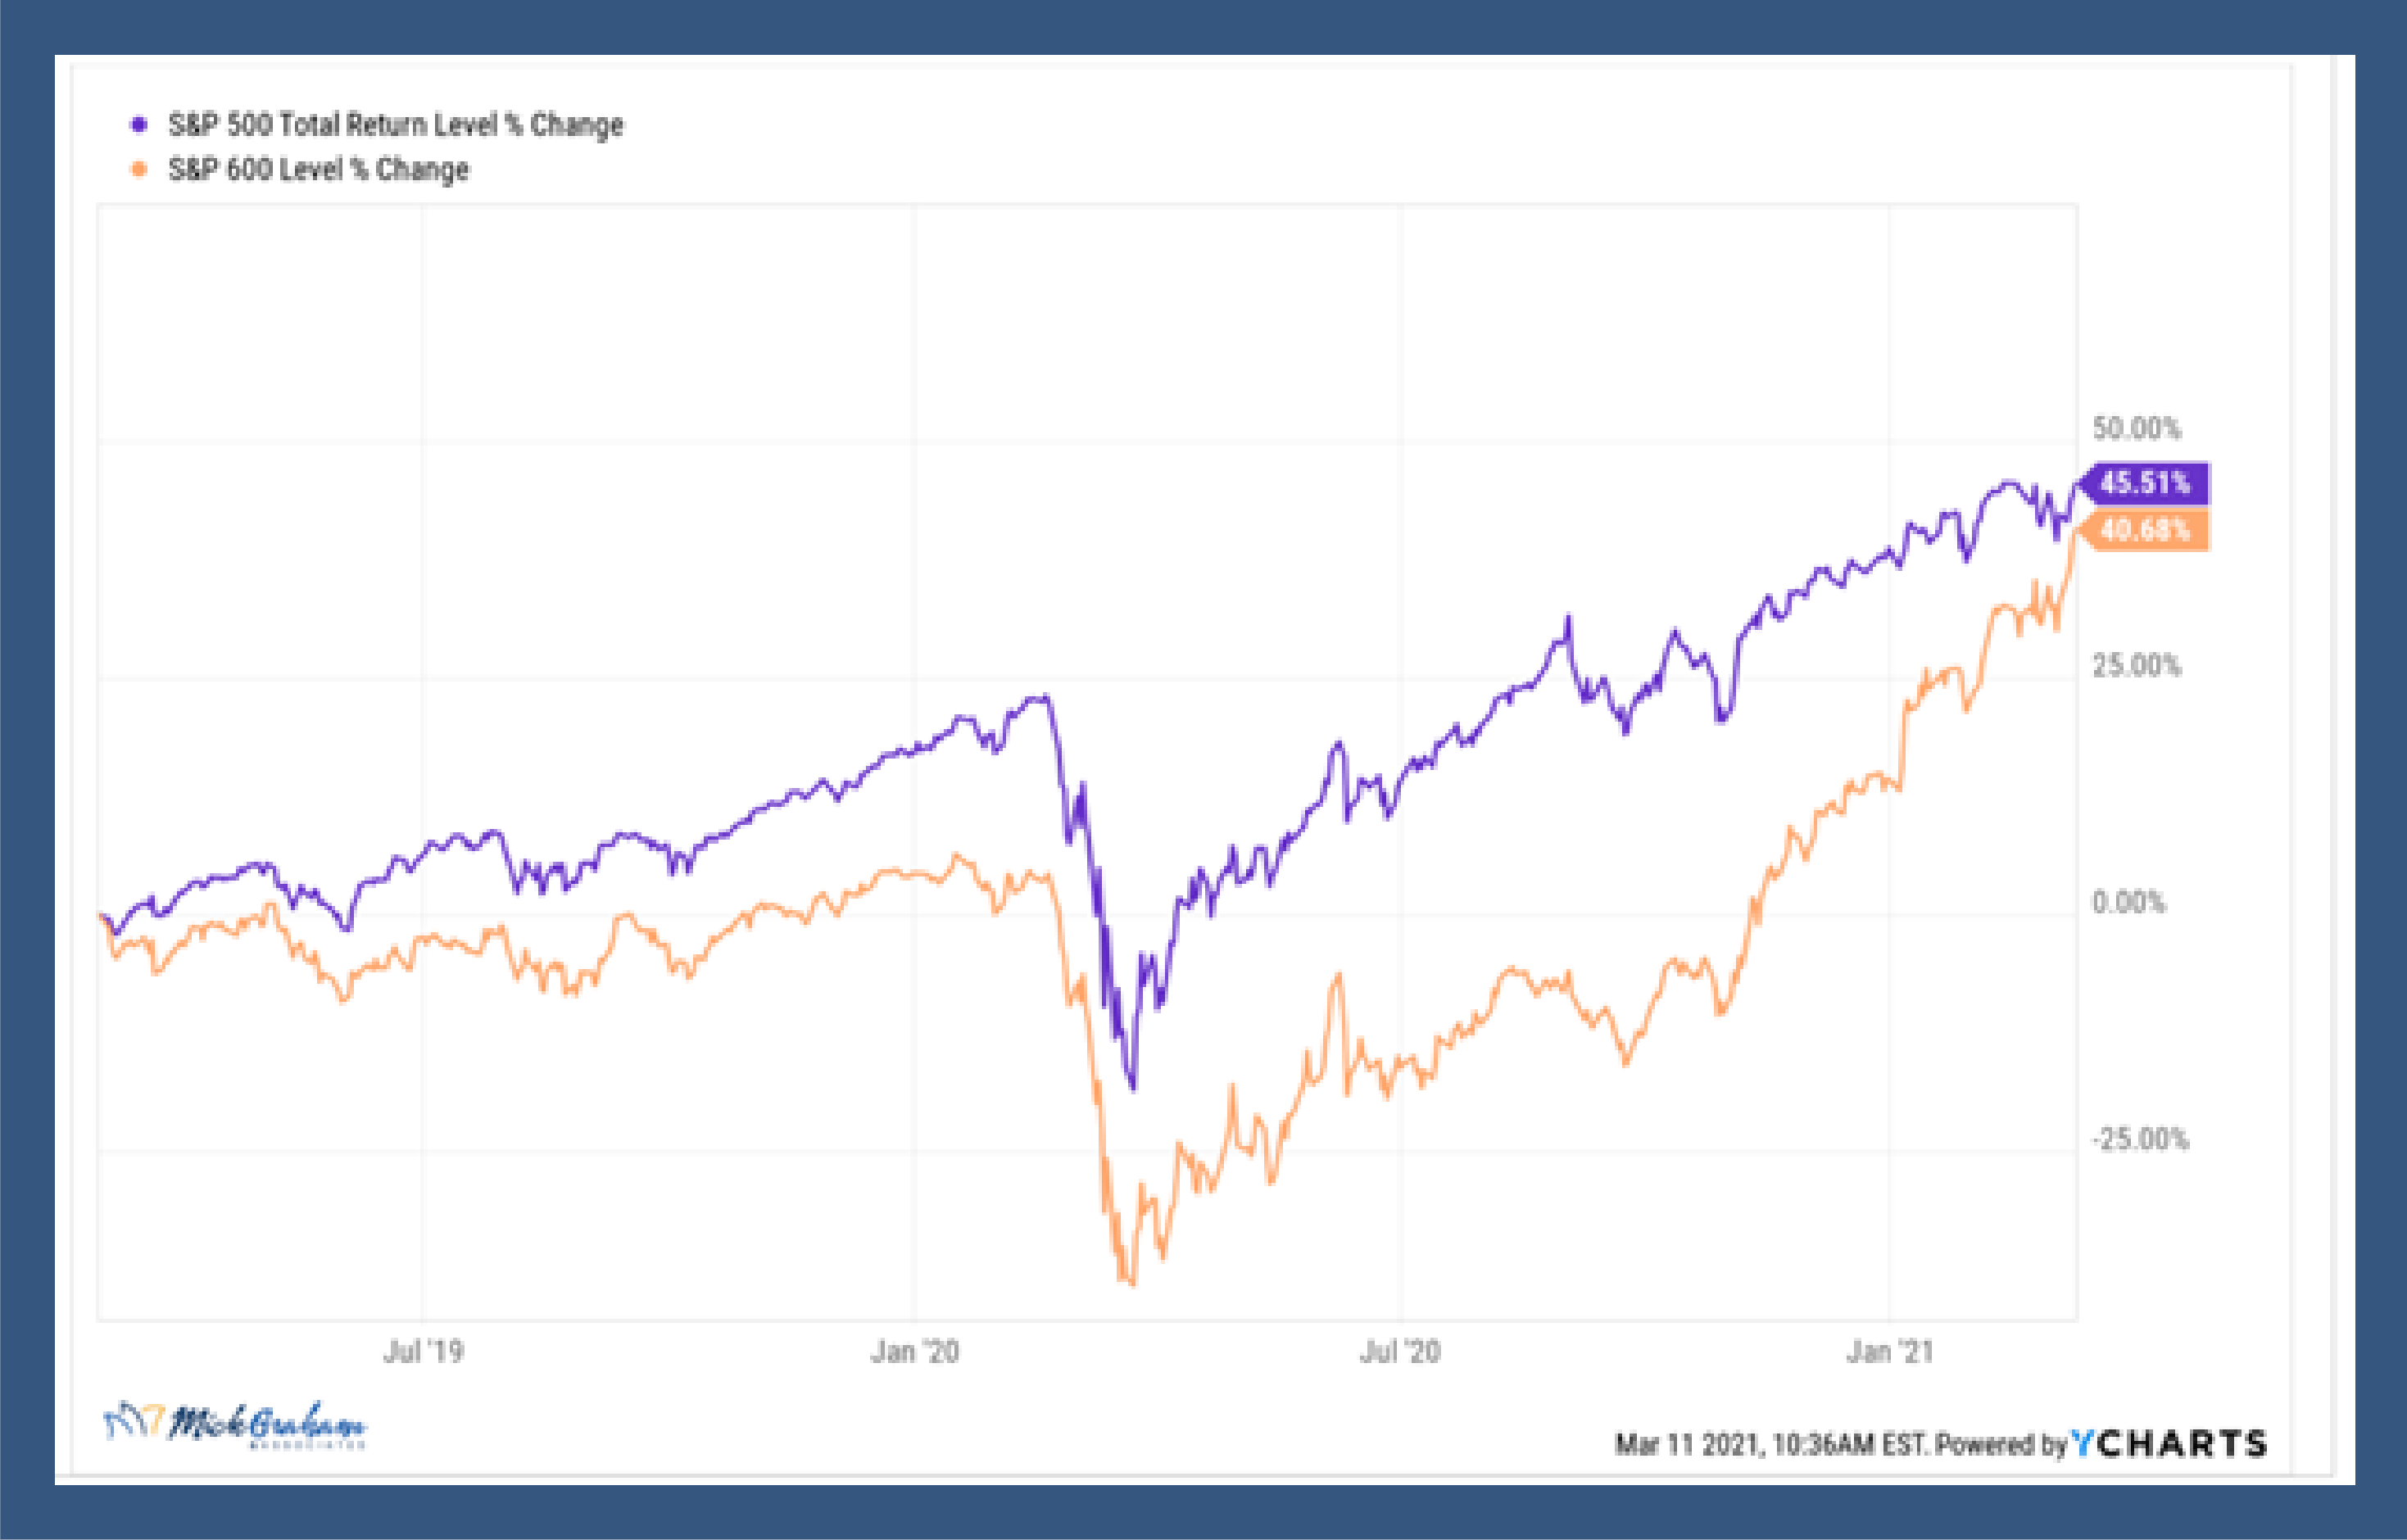
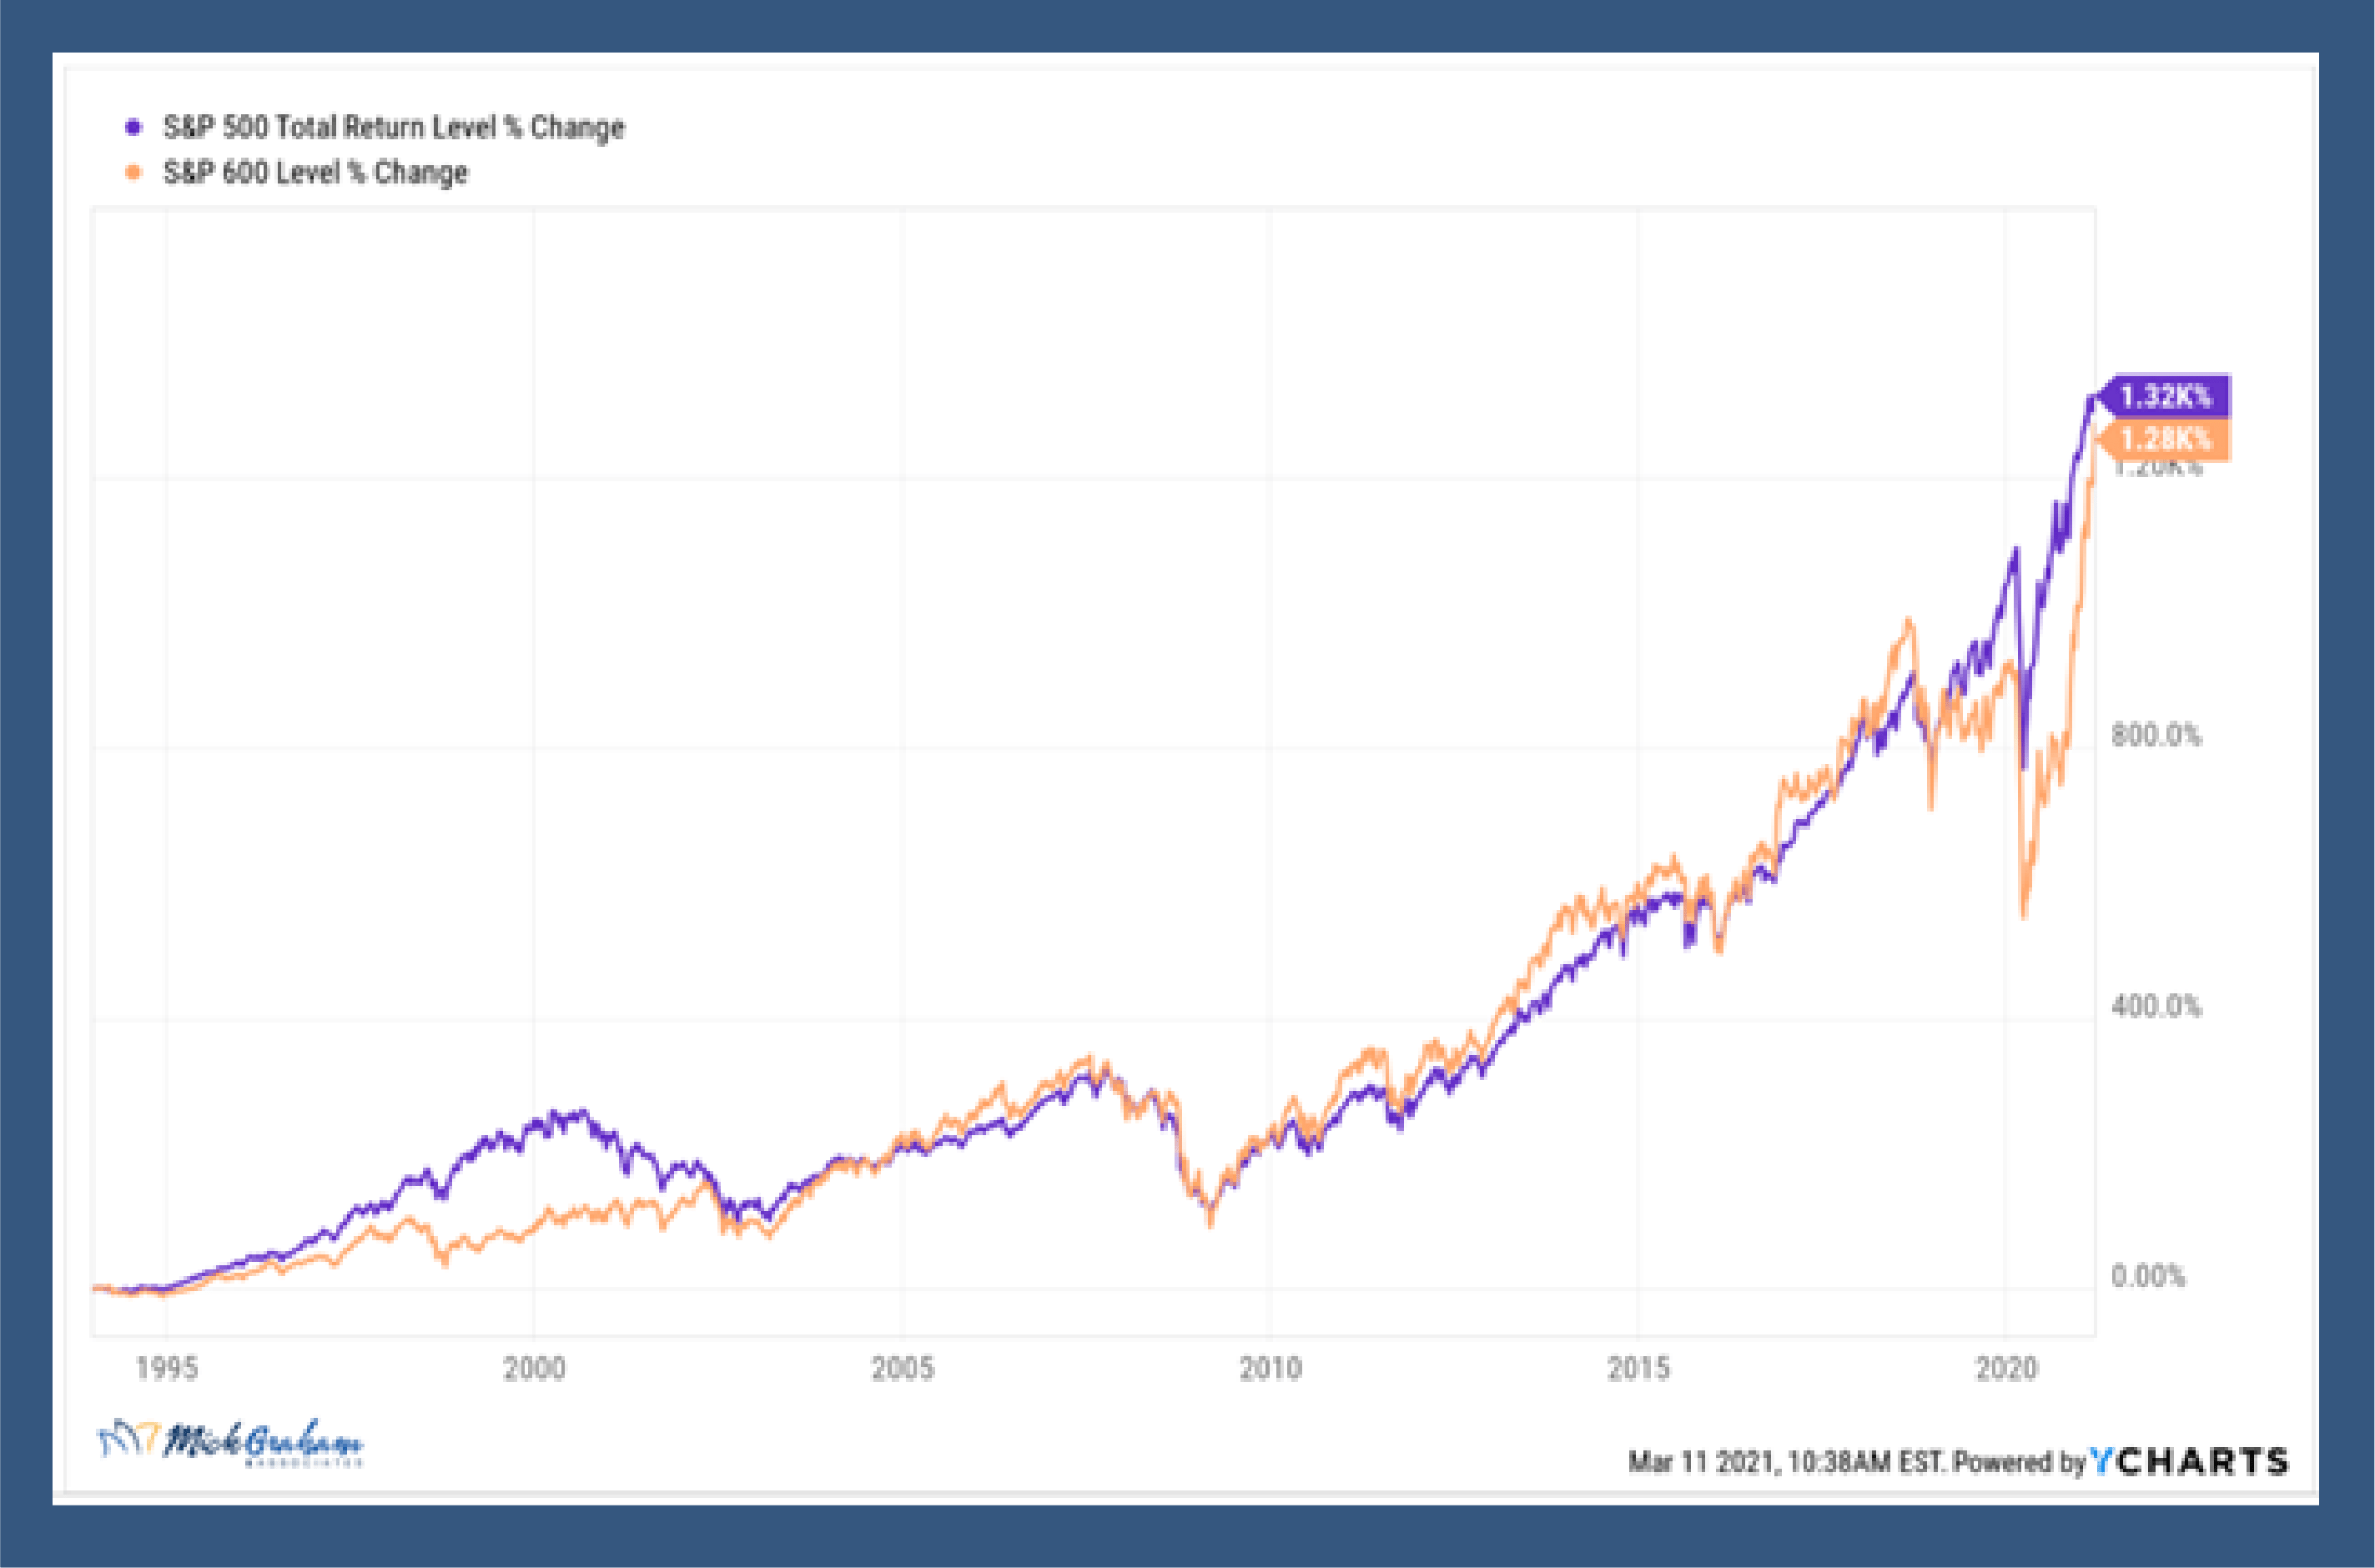
I’ll wrap up here as I know I’ve given you a lot of data, however, if nothing else I want you to take this away: It may be volatile, but my belief is that there is too much stimulus/liquidity in the market for it not to go up over the next market cycle (which I classify as 3 years). It will likely be led by names that have lagged for the last market cycle, which creates opportunities for stock pickers versus index players.
As always, should you have any questions, comments or concerns, please reach out to us.
The information contained in this report does not purport to be a complete description of the securities, markets, or developments referred to in this material. The information has been obtained from sources considered to be reliable, but we do not guarantee that the foregoing material is accurate or complete. Any opinions are those of Mick Graham and not necessarily those of Raymond James. Expressions of opinion are as of this date and are subject to change without notice. There is no guarantee that these statements, opinions or forecasts provided herein will prove to be correct. Investing involves risk and you may incur a profit or loss regardless of strategy selected. Keep in mind that individuals cannot invest directly in any index, and index performance does not include transaction costs or other fees, which will affect actual investment performance. Individual investor's results will vary. Past performance does not guarantee future results. Future investment performance cannot be guaranteed, investment yields will fluctuate with market conditions.
The S&P 500 is an unmanaged index of 500 widely held stocks that is generally considered representative of the U.S. stock market.
The S&P SmallCap 600 Index is a stock market index established by Standard & Poor's. It covers roughly the small-cap range of American stocks, using a capitalization-weighted index.

