A Cup of Joe?


To watch/listen to this week’s article please click here.
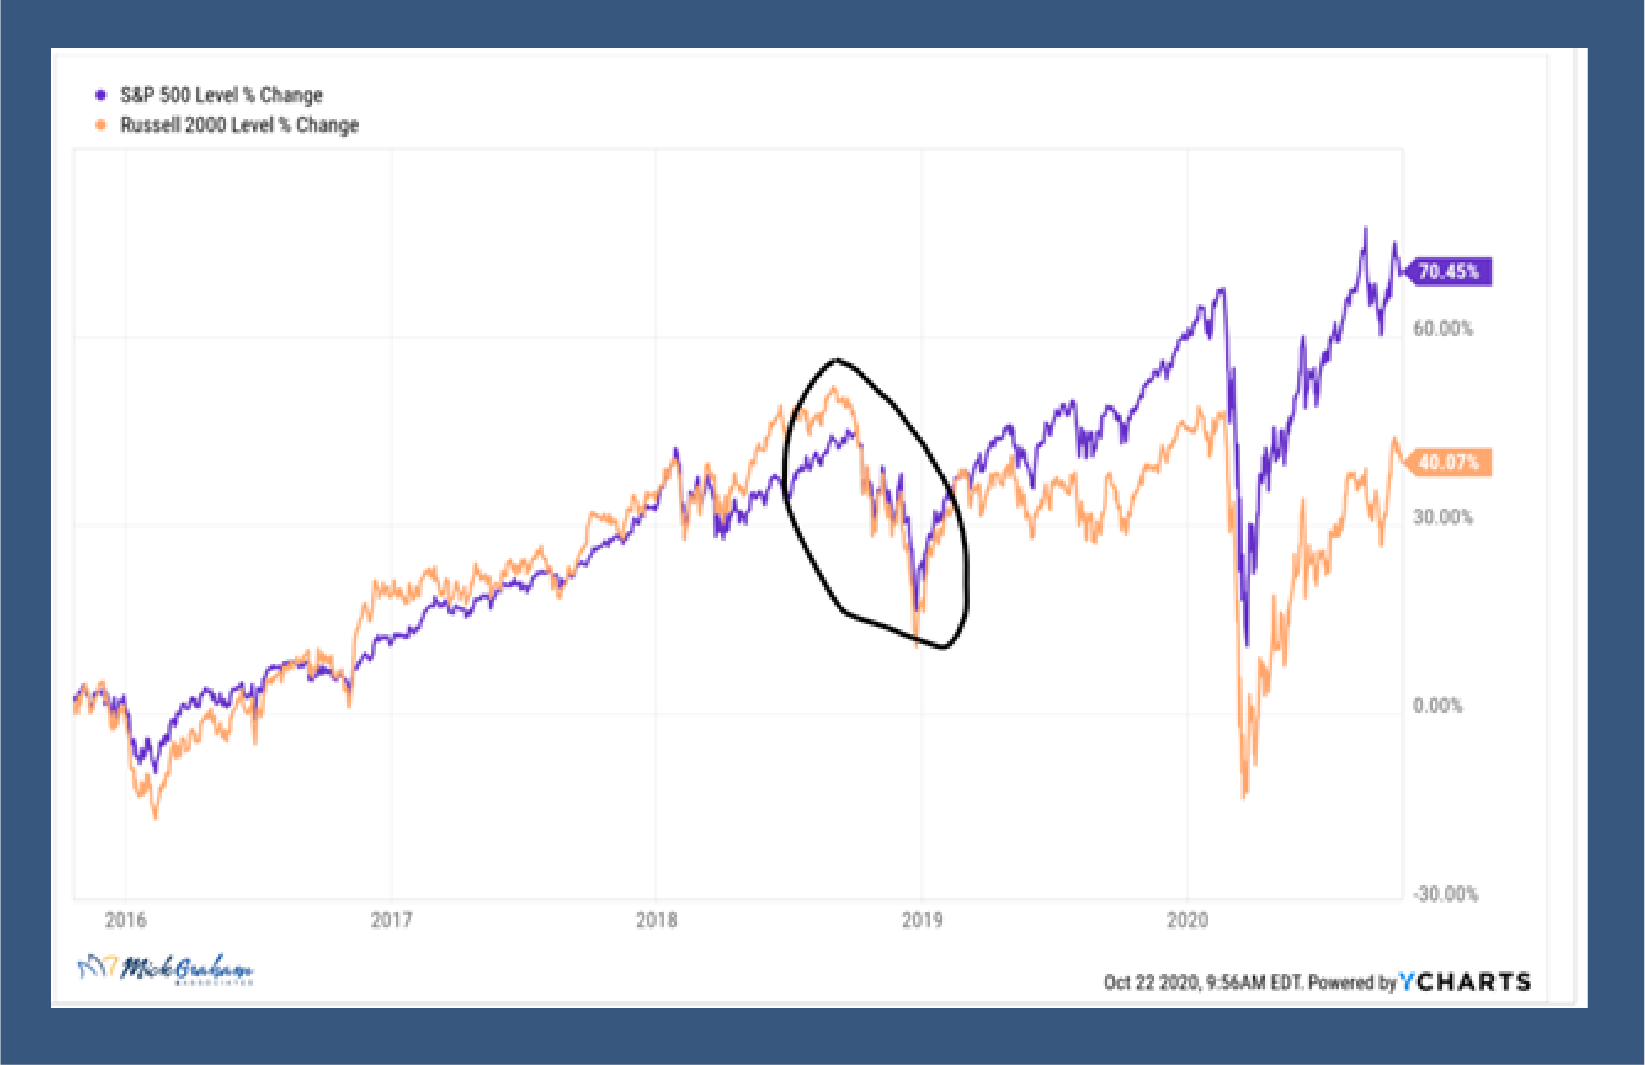
This is about as standard as it gets in the technical analysis world. The circled area above (since roughly the start of September) is forming a “cup and handle”. A cup and handle is a chart pattern that consists of a drop in price, followed by a rise back very close to the original value, followed by a smaller drop, giving the visual effect of a cup with a handle. Not unlike the espresso cup that you get at the café.
The good news about this portion of the cup and handle formation is that it’s usually followed by a rise past its previous peak!!! “Technically speaking”, (remember when I say that, I’m referring to looking at charts), this has been an orderly pullback after a near 9% rise from 9/24. Often in these cases, the pullback goes back to the 50-day moving average, (which at the time of writing) is about 3410, around 20 S&P 500 points from here.
Now you all know I don’t put much emphasis on charting to predict stock market direction, preferring fundamentals, like earnings, management teams, business plans etc., however when volatility is heightened, I pay more attention than normal.
Where we are right now is being described by most technicians as a basing pattern, while we wait for a catalyst to take us higher. What will that catalyst be? That’s anyone’s guess. Although most will point towards November 3rd.
I spent some time last week talking about the impact of a democratic victory on the markets. While I received some push back, I was happy that most remembered the quote I’ve spouted for years…”If you’ve read it, heard it, or seen it, the market has priced it.” I’ll argue that the pullback from early September was based around the polls starting to predict a Democratic sweep, and if that does in fact happen, the market has pre-priced it. So that leaves us looking at things that are unexpected, like the status quo, or the republicans actually picking up seats in the Senate. The unexpected causes volatility, and remember that volatility goes both ways, up and down.

So, like always, that leaves us with “Where to from here?” First, I’m not worried about the election on long term market returns. Capitalism will shine through, DESPITE who is in office. Sure, there may be some barriers that one party may put in place, but that’s why the phrase “If the door is closed, go through the window”, was coined. It’s what has gotten us to this point.
Second, I do believe that again, DESPITE who gets in, we will see a rotation from what has worked to what has not. Specifically, I believe smaller cap companies will start to see a benefit from the low inflation/low rate, and stimulus rich world we now live in.
You can see from the chart that since what I call the “Powell faux pas” at the end of 2018, small caps have lagged the larger caps by a long way. My expectation is that over the course of the next market cycle (I like to say a market cycle is around 3 years in duration), we will see the smaller caps catch up.
I’ve been threatening to change the Buy/Sell for the past few weeks and I did it today. I grappled with myself for a while over this, as I’ve never had a multiple this high on a stock market index since I started in the business 20 years ago. My fair value for the S&P 500 for year end 2021 is now 3655. That is based on $170 of earnings and 21.5 times the multiple. I did not give a year end 2020 number. Instead, I started the fair value line from July 1 of this year and drew a straight line through December 31, 2021. The reason being if I did, the multiple on this year’s earnings would be around 24 times, and I just can’t bring myself to do it.
I justify the multiple on TINA (There Is No Alternative), Low Rates, Massive Stimulus, Earnings improvement (See image below), and considering how long the duration is of the average bull market.

The negatives the market evaluates has will probably be met with some type of fiscal relief. Now we have to pay the piper at some stage, but for now, as we come back to earnings growth in 2021, I feel the stage is set for some market upside with the smaller companies feeling the love.
That’s it for now, with that, here’s the updated Buy/Sell.

Mick Graham, CPM®, AIF®
Branch Manager Raymond James
Office in Suntree Florida
321.610.3200
Any opinions are those of Mick Graham and not necessarily those of RJFS or Raymond James. The information contained in this report does not purport to be a complete description of the securities, markets, or developments referred to in this material. There is no assurance any of the trends mentioned will continue or forecasts will occur. The information has been obtained from sources considered to be reliable, but Raymond James does not guarantee that the foregoing material is accurate or complete. Any information is not a complete summary or statement of all available data necessary for making an investment decision and does not constitute a recommendation. Investing involves risk and you may incur a profit or loss regardless of strategy selected. Past performance is not indicative of future results. Investing in small cap stocks generally involves greater risks, and therefore, may not be appropriate for every investor.


