Equity Risk Premiums...Clear as Mud

To watch/listen to this week’s article please click here.
Let’s pick up where I left off last week. “Cautious optimism” …sounds like an oxymoron, much like “jumbo shrimp”, or being “clearly misunderstood”. My unbiased opinion to this impossible solution, is to share some old news and try to give you an “exact estimate”. Clear as Mud, right?
Without mentioning the term Equity Risk Premium last week, I started to touch on the subject. The equity risk premium refers to the excess return that investors expect over that of a risk-free rate. A risk-free rate is considered in this day and age as U.S. Treasuries.
Under the risk/return tradeoff the more risk an investor is willing to accept, the more return they expect to make. Equities (either individual or an index as a whole) can be a high-risk investment, and as such investors expect a premium above that of a risk free. To calculate the Equity Risk Premium, you first need to calculate the expected return from an investment. The expected return of an equity can be calculated in two ways:
- The earnings-based approach. Simply put, it’s the earnings expected to be generated by an individual stock (or components of an index of stocks) divided by the stock (or index) price.
- The dividend-based approach. Expected equity returns equal, dividend per share, divided by the stock price, plus the dividend growth percentage.

Thanks for the lecture Mick, but what the heck has that got to do with anything??? Well this Pricing Model, has for many years been used by strategists in predicting the future returns of stock markets. We now live in a different time. You will see, and I have shown you charts in the past, that highlight how expensive the market is from a Price to Earnings multiple. However, today we live in a near zero risk-free return rate, that if earnings continue their pattern of long-term growth, then the equity premium will be much bigger than in previous years. This provides a strong argument to drive up the price to earnings multiple to levels historically high.
Now don’t get me wrong, I definitely thought we were expensive at the start of the year, and I believe there are individual names that are expensive now. However, we live in a big world, and I believe the time is now to start looking beyond the big five stocks that have driven equity returns, not only since the March lows, but going back a few years.

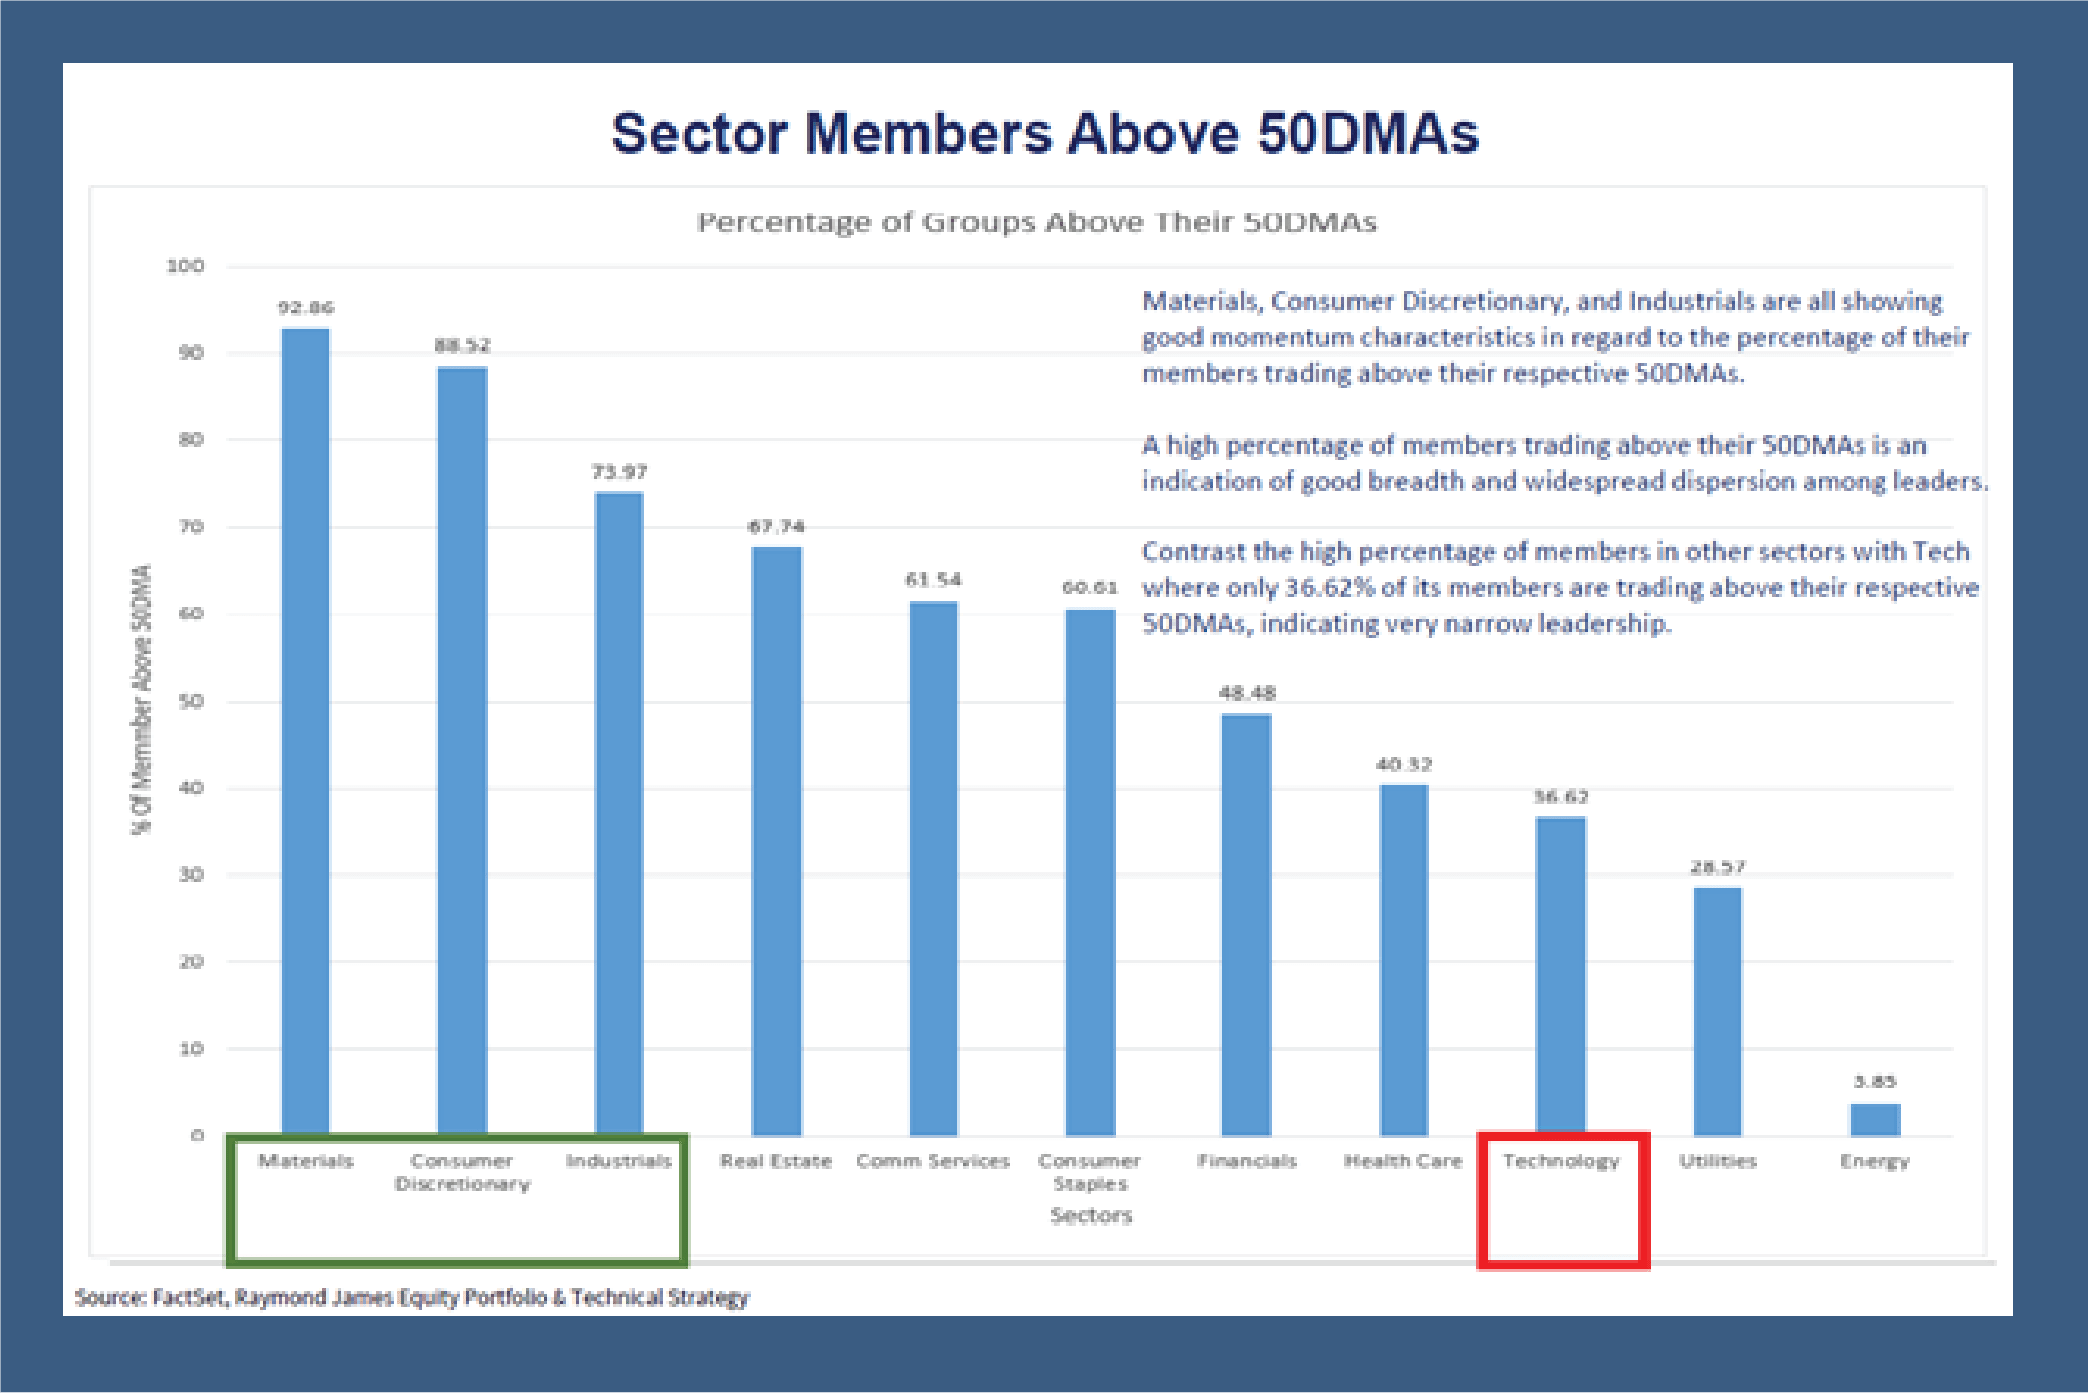
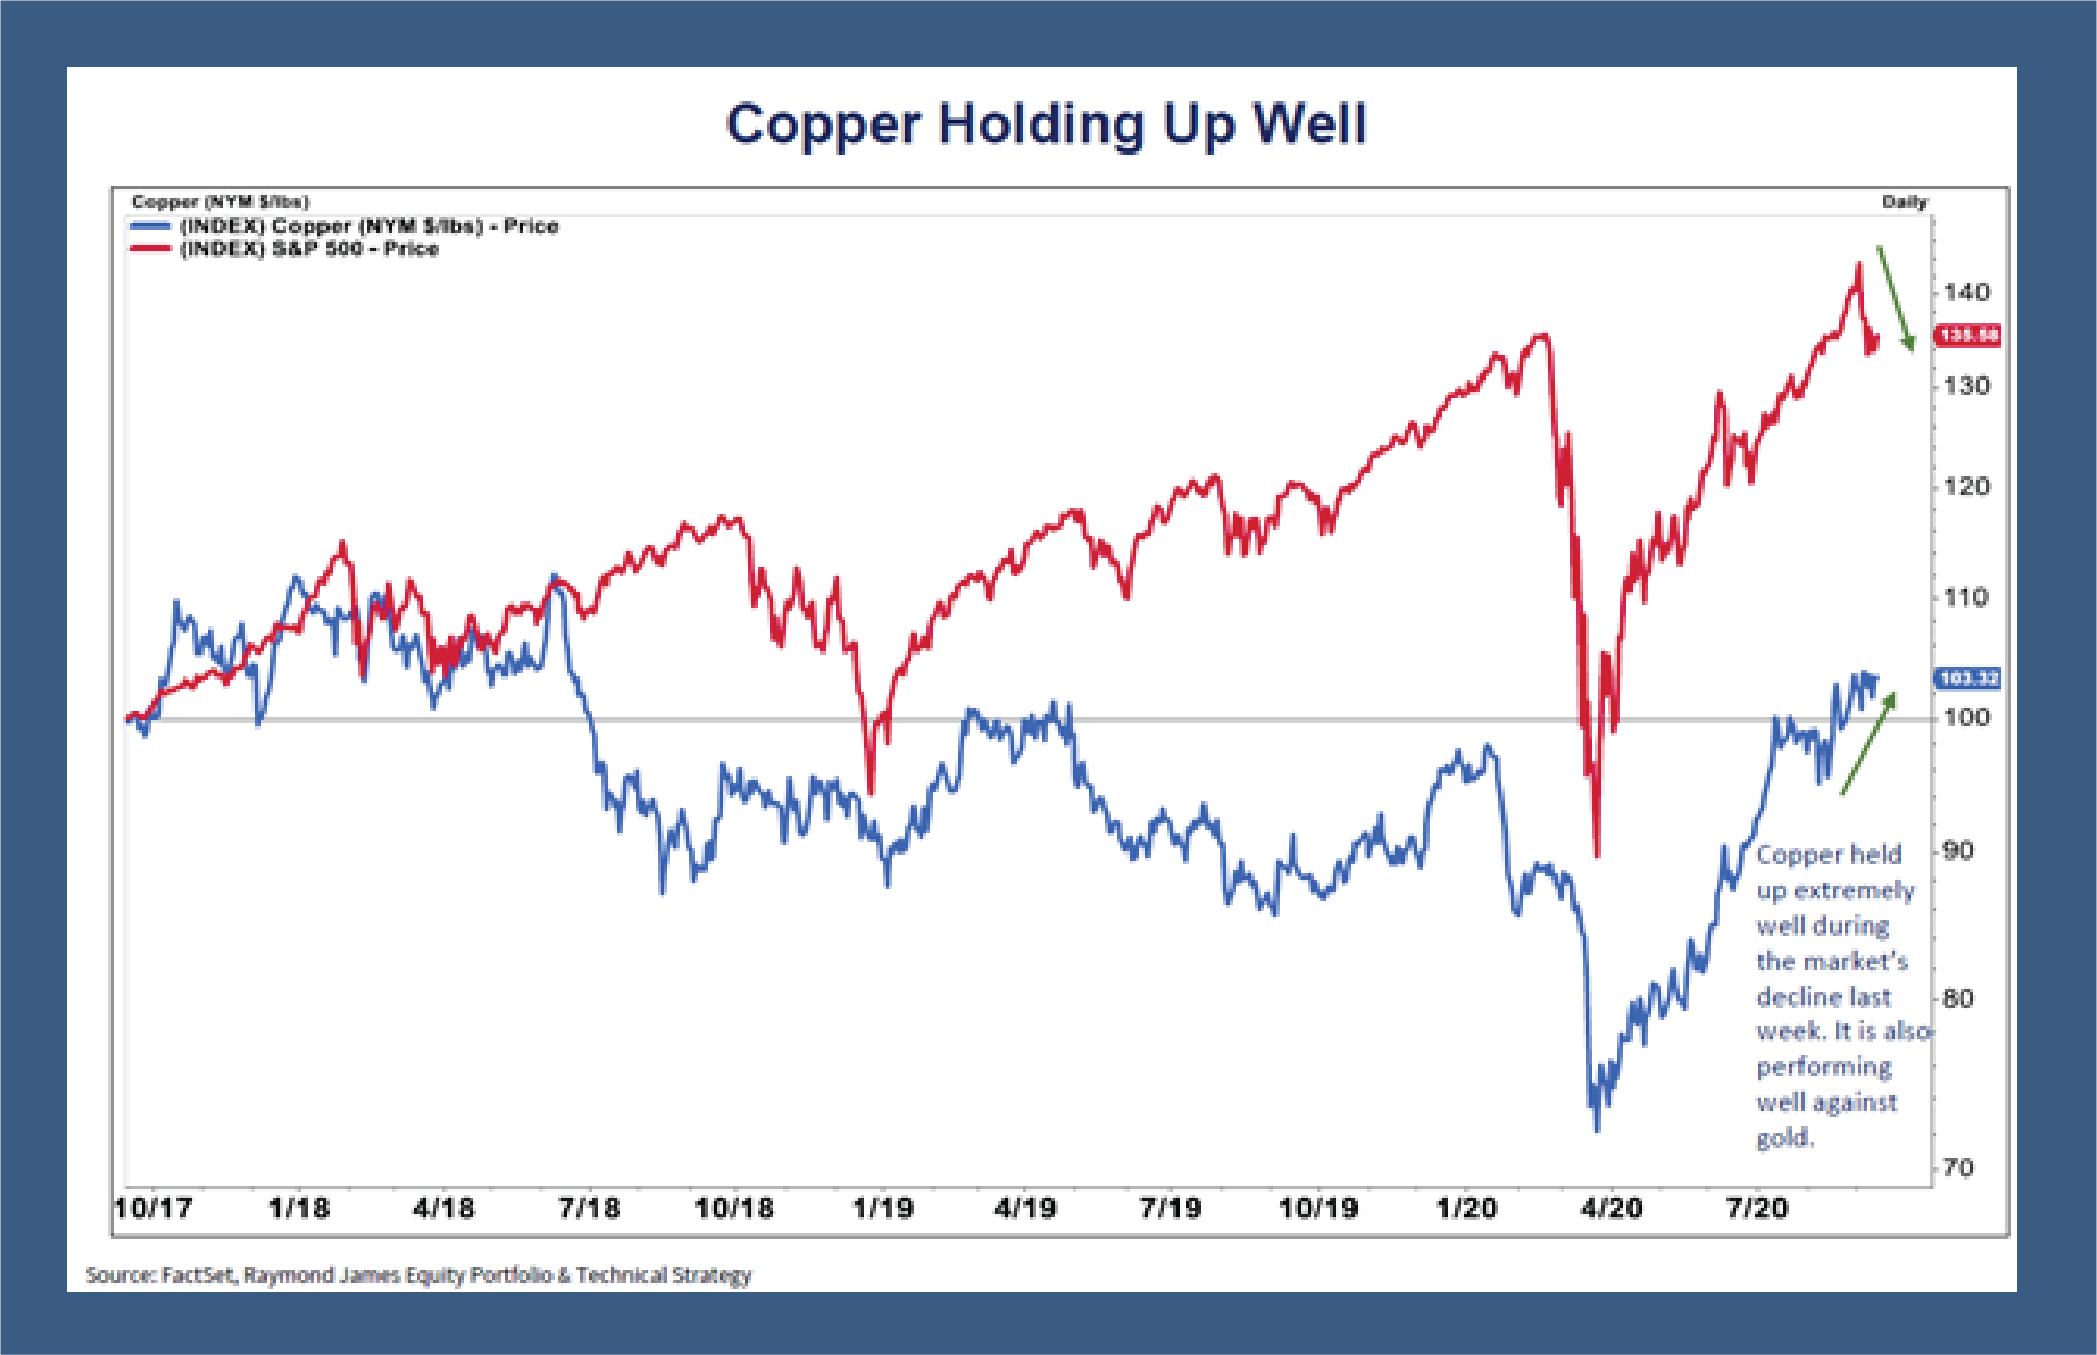
The rotation away from technology to the “cyclicals” is starting to happen. Time will tell if this is a head fake or the start of a true rotation. Historically when an economy is recovering the cyclicals are the leaders. Copper, a metal often referred to as a leading indicator of the economy, has not only rallied back nicely since the March lows, but held up very well in the recent market declines. This can signal an economic recovery.

Time now to dust off the watchlist for stocks, and deep dive some research. No rush however, we have an election approaching, that I predict will provide us opportunities to buy in at better pricing.
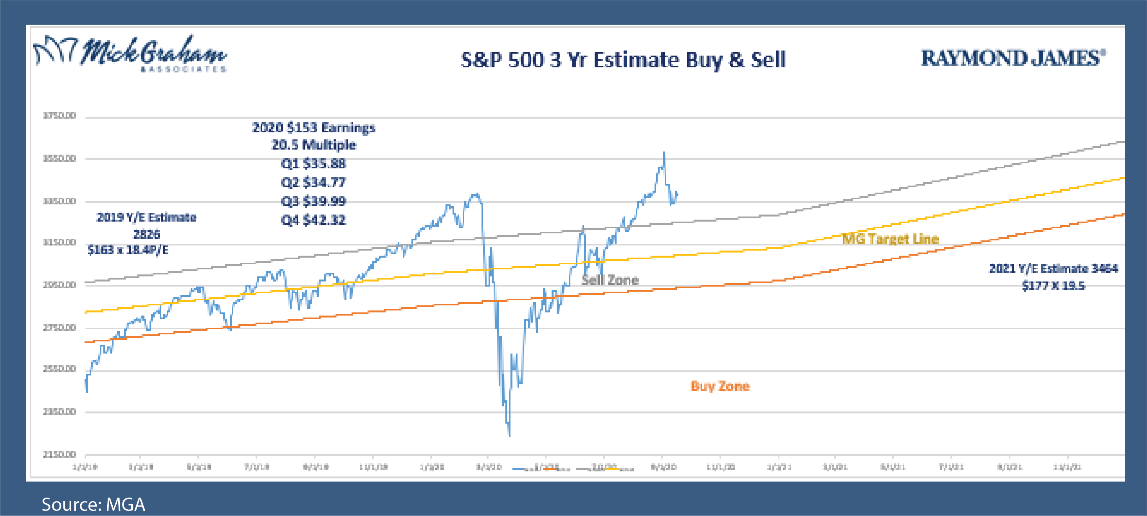
With that said here’s the Buy/Sell.

The displayed charts are for illustrative purposes only. The foregoing information has been obtained from sources considered to be reliable, but we do not guarantee that it is accurate or complete, it is not a statement of all available data necessary for making an investment decision, and it does not constitute a recommendation. Any opinions are those of Mick Graham and not necessarily those of Raymond James. Prior to making any investment decision, you should consult with your financial advisor about your individual situation. Investing involves risk and you may incur a profit or loss regardless of strategy selected. Expressions of opinion are as of this date and are subject to change without notice.
Investing in commodities is generally considered speculative because of the significant potential for investment loss. Their markets are likely to be volatile and there may be sharp price fluctuations even during periods when prices overall are rising.
The S&P 500 is an unmanaged index of 500 widely held stocks that is generally considered representative of the U.S. stock market. Keep in mind that individuals cannot invest directly in any index, and index performance does not include transaction costs or other fees, which will affect actual investment performance. Individual investor's results will vary. Past performance does not guarantee future results.

