Election Reluctancy

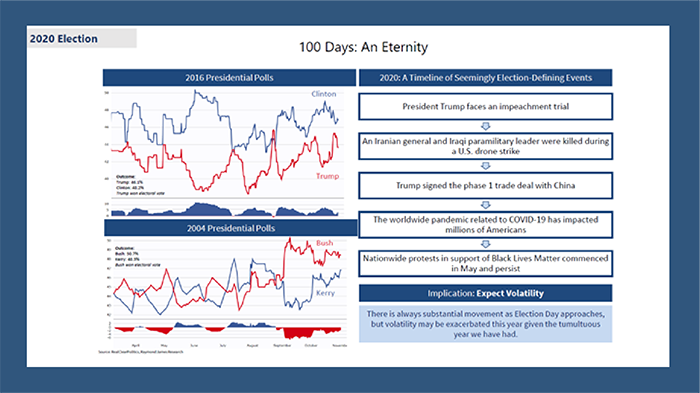
I’ve resisted the urge to think too much about the election, as I believe the market won’t start to pay too much attention to it until around 100 days out. Well we’re here. So, I thought we should spend some time reviewing past results and the effect that have been felt by the markets. I’m certainly not stating a political position here, just looking at historical figures to hopefully provide some insight. I still call them all Poly-Ticks (poly, a Greek word meaning many, and ticks, blood sucking parasites).
Polls
I wrote a few weeks back, the polls currently showing a Biden victory may show some insight to sentiment today, but they have shown to be terrible predictors of elections. There is the possibility of a democratic sweep, which the market will undoubtedly view to mean higher corporate and individual taxes. A divided government is generally viewed positively as not much can actually get accomplished and everyone knows what the status quo looks like.
The most commonly used words in investing have been thrown around a lot on the Fox/CNN networks are, “This Time It’s Different”. If there has ever been an argument for dropping those four words, then this is it. Working through a pandemic, massive fiscal stimulus, (a new round expected this week) and the divide in the two parties has us in unprecedented times. Although history can provide a guide, I feel what ever the result we can count on volatility. The past couple of years has shown me how quickly things can move when fear shows itself.
Mail-in Voting
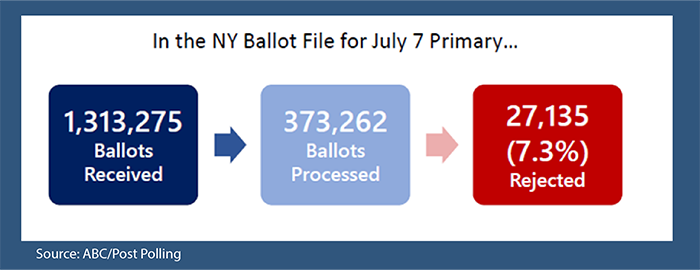
This election is expected to have the highest level of mail-in votes than any other. This has several potential effects, with the biggest being that we may not get a result on the night of the election. Recent primaries in New York still have no winner over a month later, and a 7.3% rejection rate of mail in votes, according to ABC/Post Polling.
Market Overview
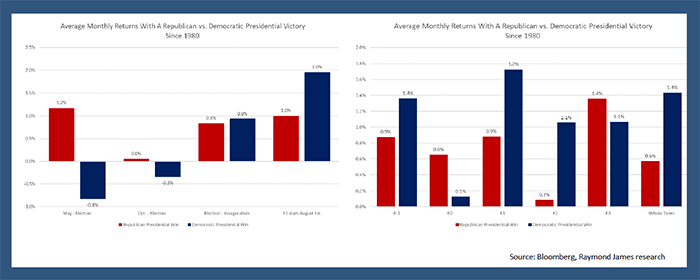
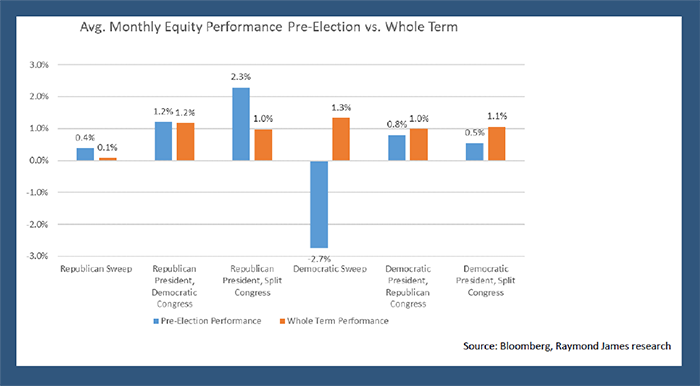
On average, equity markets are cautious ahead of elections, then play catch up quickly.

Democratic presidential wins have been preceded by weak market, but tend to be positive in the first 9 months.
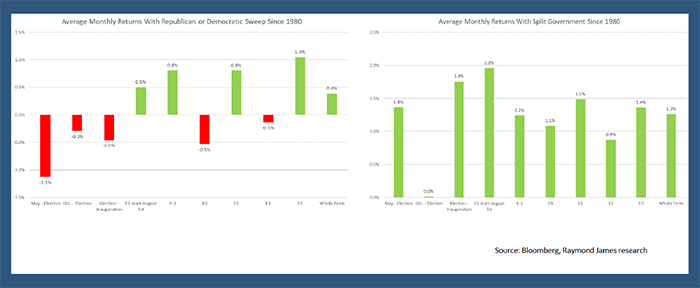
Historically, the market does far worse in front of an election sweep and far better in front of a split government.
Since 1980, the equity market does better pre-election when a republican wins, but democratic market fear is typically reversed over the next four years.
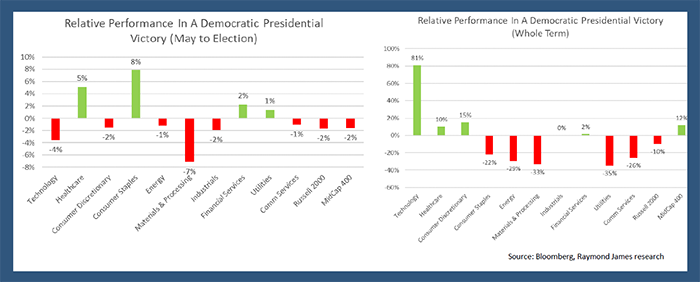
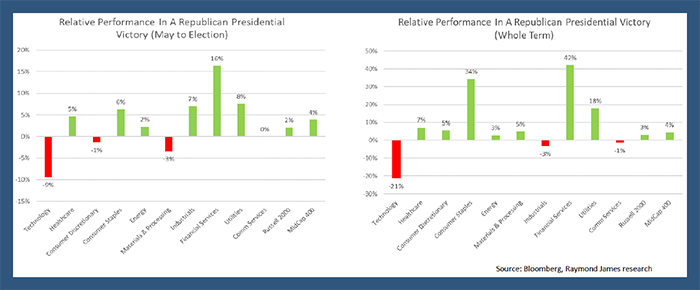
The sectors show some clear favorites based on which party holds the White House.
Summary
Into the Election Trade. Equity markets tend to trade cautiously into elections, that could easily be the case for the next few months given the democratic lead and potential for an election dispute, and a strong second quarter rally.
This time may be different!! Historically when stocks weaken into an election, they tend to recover relatively quickly as investor focus shifts from high profile fears to a slower changing, more moderate reality.
Sustained Support Needed. The economy needs substantial, sustained fiscal support through at least 2021 to return to anything resembling full employment, so a split government may not be as bullish as it has historically.
If we get a democratic sweep the assumption would be an initial market sell off for fears of higher taxes and potential inflation, but ultimately lead to better performance in specific equity sectors and the smaller caps.
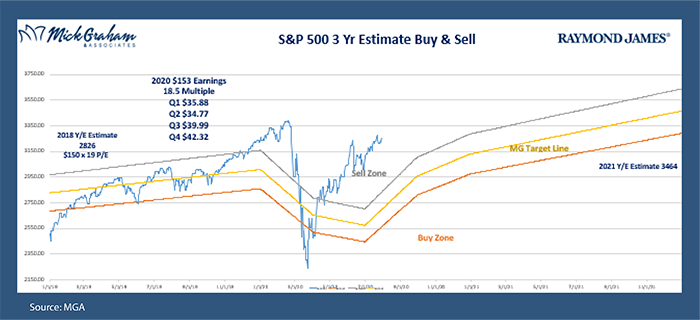
Regardless of the ultimate outcome, this time around should be entertaining. With all that said, here is the buy/sell.
This market commentary is provided for information purposes only and is not a complete description of the securities, markets, or developments referred to in this material. There is no guarantee that these statements, opinions or forecasts provided herein will prove to be correct. Investing involves risk and you may incur a profit or loss regardless of strategy selected. Prior to making an investment decision, please consult with your financial advisor about your individual situation. Expressions of opinion are as of this date and are subject to change without notice.
The S&P 500 is an unmanaged index of 500 widely held stocks that is generally considered representative of the U.S. stock market. The S&P MidCap 400® provides investors with a benchmark for mid-sized companies. The index, which is distinct from the large-cap S&P 500®, measures the performance of mid-sized companies, reflecting the distinctive risk and return characteristics of this market segment. The Russell 2000 Index measures the performance of the 2,000 smallest companies in the Russell 3000 Index, which represent approximately 8% of the total market capitalization of the Russell 3000 Index. Keep in mind that individuals cannot invest directly in any index, and index performance does not include transaction costs or other fees, which will affect actual investment performance. Individual investor's results will vary. Past performance does not guarantee future results. Diversification and asset allocation do not ensure a profit or protect against a loss.
Sector investments are companies engaged in business related to a specific sector. They are subject to fierce competition and their products and services may be subject to rapid obsolescence. There are additional risks associated with investing in an individual sector, including limited diversification.

