Short & Sweet
To watch/listen to this week’s article click here or copy & paste the following URL: https://youtu.be/ysB-ZBdX5vc
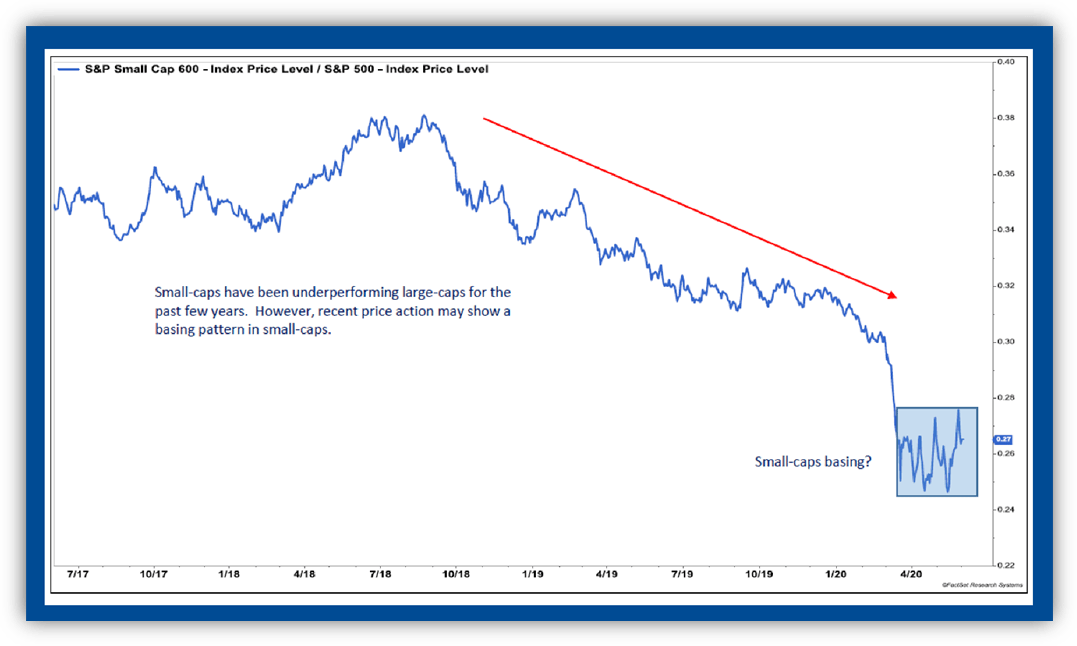
Short and sweet this week. Nothing much has changed from the last few articles as far as fundamentals. I have my shopping list ready, which will be towards small cap and emerging markets, I would just like to see a pause in the market before I start to commit any more capital.
A few charts that I’m watching…
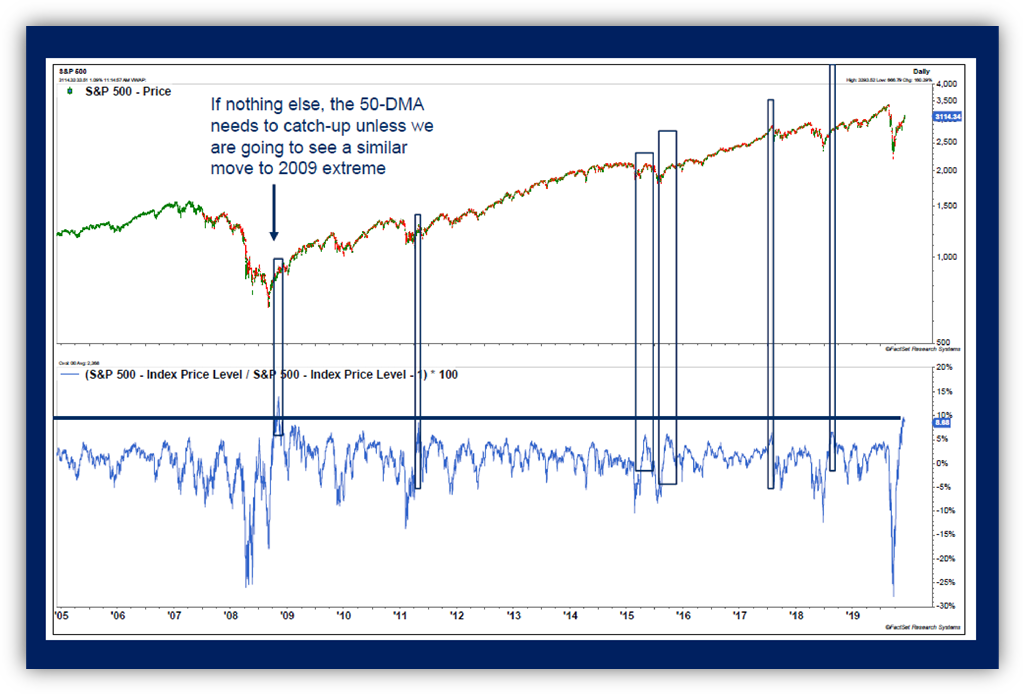
The S&P 500 is currently trading around 8% above the 50-day moving average. This is the highest level above that it has been dating back to the recovery after the ‘08 financial crisis. This tells me that we should be on the lookout for a pause or even pullback. The chart below shows how this has panned out in the past.
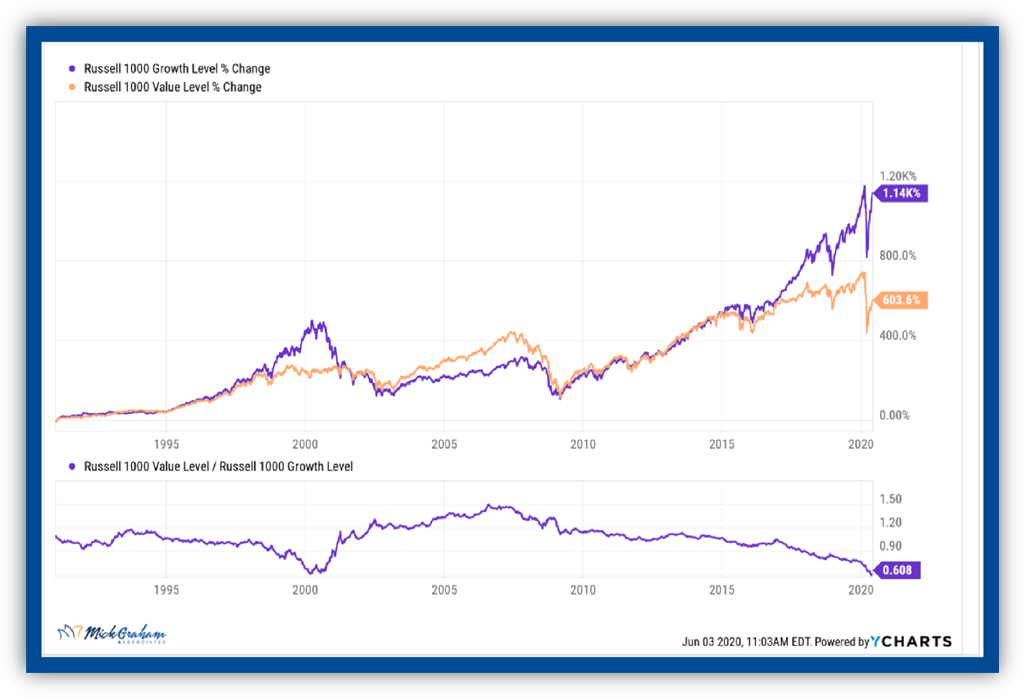
We’re still waiting to see the rotation from growth to value. This differential is now at historic levels.
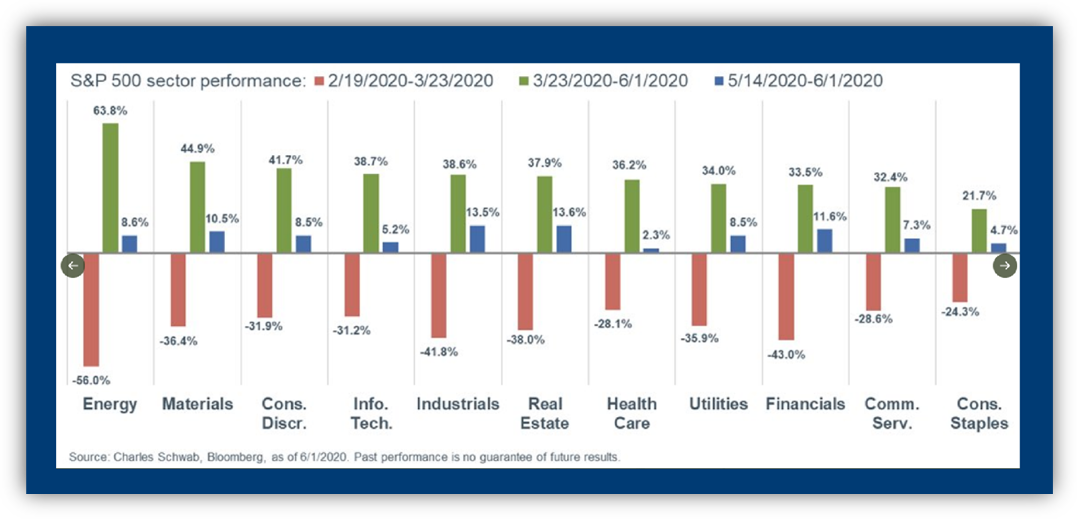
This chart shows that the things that have been beaten up the most have come back the most. It’s difficult to make yourself want to buy the sectors that are the worst, however that's where a disciplined investor may find opportunities….
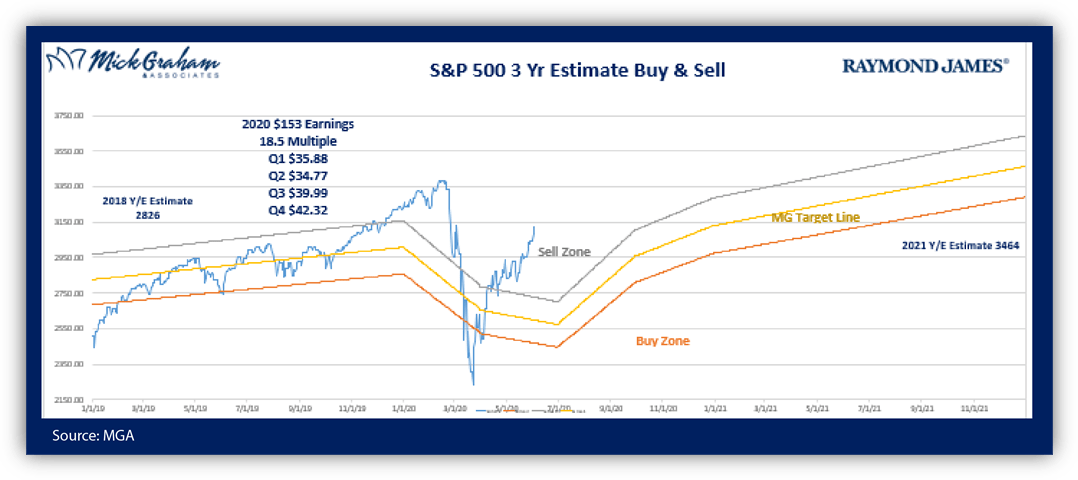
I’ll go into a bit more detail in the video related to these charts. With that, here’s the buy/sell.
The information contained in this report does not purport to be a complete description of the securities, markets, or developments referred to in this material. The information has been obtained from sources considered to be reliable, but we do not guarantee that the foregoing material is accurate or complete. Any opinions are those of Mick Graham and not necessarily those of Raymond James. Expressions of opinion are as of this date and are subject to change without notice. There is no guarantee that these statements, opinions or forecasts provided herein will prove to be correct. Investing involves risk and you may incur a profit or loss regardless of strategy selected. Keep in mind that individuals cannot invest directly in any index, and index performance does not include transaction costs or other fees, which will affect actual investment performance. Individual investor's results will vary. Past performance does not guarantee future results. Future investment performance cannot be guaranteed, investment yields will fluctuate with market conditions.
The Russell 1000 Value Index measures the performance of those Russell 1000 companies with higher price-to-book ratios and lower forecasted growth values.
The Russell 1000 Growth Index measures the performance of those Russell 1000 companies with higher price-to-book ratios and higher forecasted growth values.
The S&P SmallCap 600 is a market cap weighted index that measures the performance of the small-cap segment of the market. The index is composed of 600 constituent companies.
