A Closer Look at the Coronavirus

So, we have seen some downside volatility in the past week, which you must look very closely at the chart below to see. It has taken a potential global epidemic to make it happen, however we have something threatening this continual grind higher.
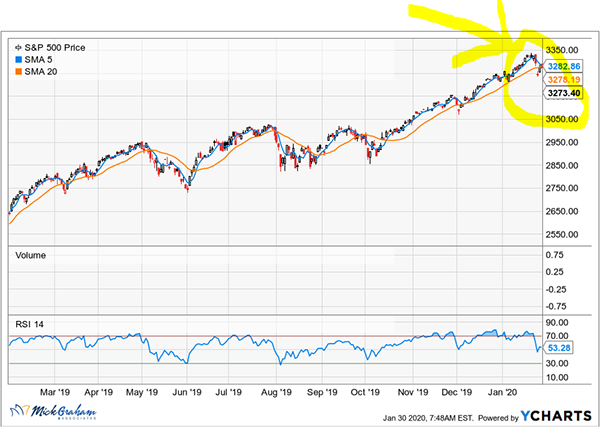
As the death toll in China increases to over 170 deaths, and India, the Philippines, and Australia have reported their first cases, the virus has now affected more people than the SARS outbreak in 2002-2003. I’ve read opinions that the virus could affect a slowdown in China by about 3% to over 10%. My view is to the former and whatever affect hits the economy, will be recovered quickly. To their credit, China seems to be reacting much faster than previous times (SARS & MERS).
I’m not trying to underplay what a disease of this nature can do to an economy, however I’m more concerned with valuations and expected growth. We are continuing to sneak up the multiple on the S&P 500 and
 although I acknowledge that earnings are expected to grow in the coming year, I feel that fair value is already in through year end.
I heard a great acronym for the stock market move over the past year…TINA or “There Is No Alternative”. Bonds provide little return at these levels and the risk of owning long term bonds with low rates creates its own risk. Cash is paying near nothing, although money markets can give you between 1-2% while you wait. With that as the alternative to the stock market, it leaves you saying, where can I go?
First, I’ll tell you that the rally we are in has potential to continue for a long period. It’s hard to fight against. Second, there is a strong correlation between the Fed Balance Sheet and P/E multiples. Since October last year the Fed has pumped $60 Billion a month into the world financial markets by purchase of treasuries. (See chart from New York Times).
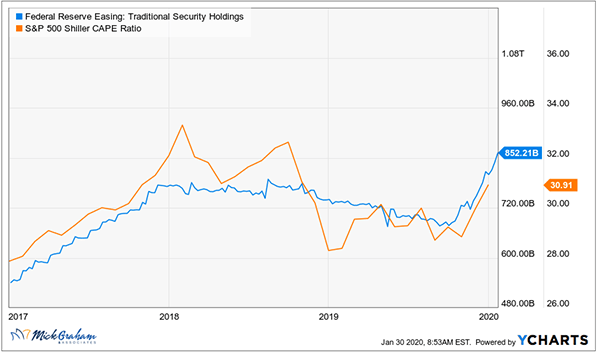
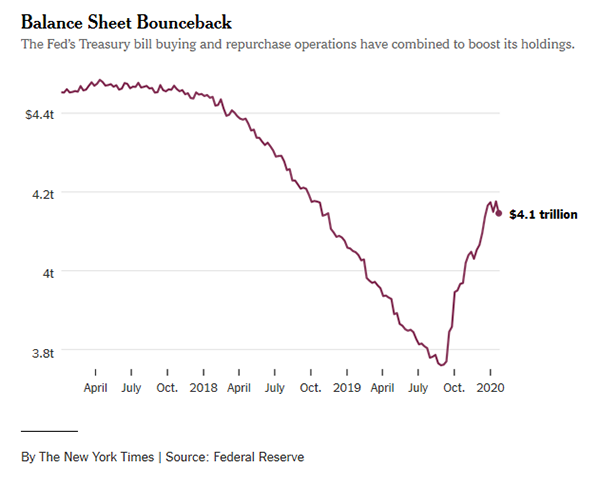
You could be forgiven to think this is Q/E (Quantitative Easing) all over again. However, the Fed stressed in their October meeting this is not Q/E, but rather the central bank trying to keep money markets in check after a messy episode in the REPO market last year (short term loans between banks). Whatever you want to call it, there seems to be a strong correlation between when the Fed looks to reduce the balance sheet that multiples of the market tends to retract. When that happens, you need the earnings side of P/E to kick it up, and I’m not sure that can happen to the extend we would need.
No, it’s not time to panic, however another great risk reduction strategy, “Rebalancing” should be at top of mind.
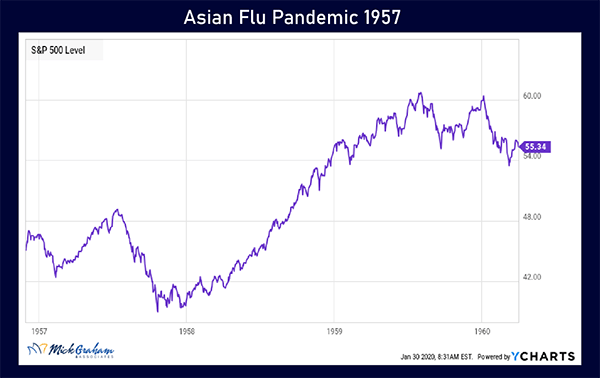
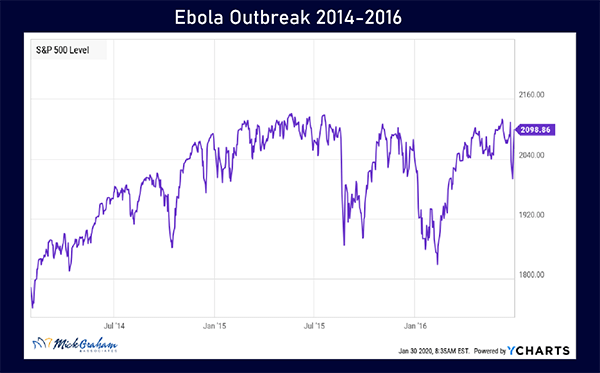
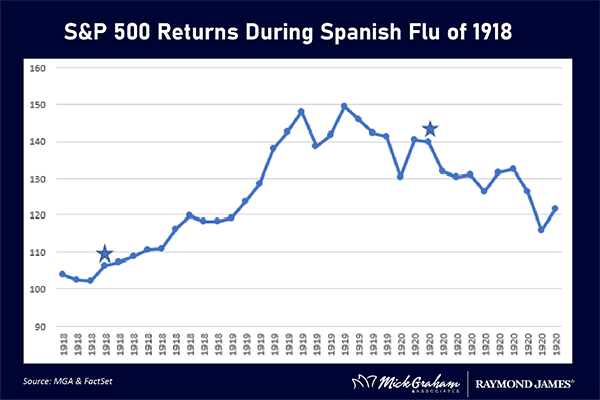
With that said, here’s the Buy/Sell. I’ve included several historical charts referencing the market’s reaction to epidemics.
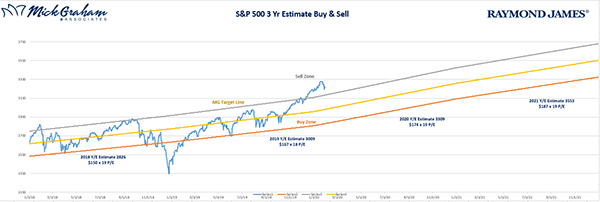
Source: MGA
Any opinions are those of Mick Graham and not necessarily those of RJFS or Raymond James. The information contained in this report does not purport to be a complete description of the securities, markets, or developments referred to in this material. There is no assurance any of the trends mentioned will continue or forecasts will occur. The information has been obtained from sources considered to be reliable, but Raymond James does not guarantee that the foregoing material is accurate or complete. Any information is not a complete summary or statement of all available data necessary for making an investment decision and does not constitute a recommendation. Investing involves risk and you may incur a profit or loss regardless of strategy selected. Past performance may not be indicative of future results. The S&P 500 is an unmanaged index of 500 widely held stocks that is generally considered representative of the U.S. stock market.

