3rd Quarter Earnings & 2020 Outlook

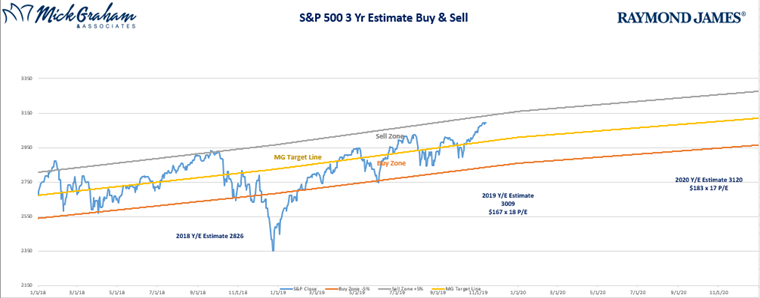
We now have about 95% of companies reporting earnings for their 3rd Quarter 2019, and so far, we have a slight beat on the expectations. Remembering it all comes back to earnings, the market’s current value is around 3-4% higher than my fair value level. We are looking like being on track for our year end target of $163 per share for the S&P 500.
Most analysts across Wall Street have earnings growth slowing in 2020 to somewhere between 4-7%. Last year when I set my 2020 numbers I had it growing around 10%, however we’ve had a number of barriers to exponential earnings growth this year, mainly related to trade. As such, I am lowering my 2020 earnings number to $176 (from $183) and lifting the multiple I placed on the market from 17 times to 18 times, which lifts my 2020 year end target for the S&P 500 to 3168 (from 3120).
 Earnings has always been where I’ve spent the majority of time. However, what’s giving me a headache now is what multiple to place on those earnings. I spent some time recently looking at trailing multiples and we discovered that due to a growth bias in the index, and a move from tangible assets to non-tangible assets (meaning most companies in the index previously built and sold things-now it’s software related), the multiple should rise each year…the question is, how much?
Using the average yearly increase going back to the start of the internet, we decided to add 0.1 to each year’s multiple from the year before. See graph below.

Trailing multiples in the last few years have moved a lot, dropping to 16.5 times at the end of last year, after the swift 20% drop from the major indexes in the late 2018. I would suggest that in a normal environment that our multiple for 2020 should be around 19. If and when we pen a substantial trade deal, I will lift our multiple to that number or higher based on the details. In this case I could easily see the index rising to 3432 (19.5 x $176) a 10% jump from where we are now.
Perhaps the biggest bullish signal I see presently is that there is still a great deal of fear in the market. Short interest is above historical averages and cash held in money market funds is over 3.5 Trillion (we haven’t had this much in cash since the latter stages of the financial crisis). Furthermore, we still have people talking about recessions in the next 12-18 months.


I will however stay cautious through this time. My experience is that when making deals with “proud” parties, common sense can be put on the sideline till the politics are handled. In the short term I see some signals that could be signaling the market getting ready for a pause or even a 3-% pullback. Longer term, I still see several years left in this bull market.
If you read through the numbers above and are asking yourself, from where we are now and where Mick thinks the market will be is within a few percentage points, you’d be right. That does not mean I am suggesting we run a hide or make wholesale changes. If you are thinking that then you are giving me way more credit than I deserve. My strategy at this stage is raise a little cash and should we get a pullback then look for opportunities.
With all that, here is the buy/sell. Have a great week.

Source: MG&A
The information contained in this report does not purport to be a complete description of the securities, markets, or developments referred to in this material. The information has been obtained from sources considered to be reliable, but we do not guarantee that the foregoing material is accurate or complete. Any opinions are those of the author and not necessarily those of Raymond James. Expressions of opinion areas of this date and are subject to change without notice. There is no guarantee that these statements, opinions or forecasts provided herein will prove to be correct. Investing involves risk and you may incur a profit or loss regardless of strategy selected. Keep in mind that individuals cannot invest directly in any index, and index performance does not include transaction costs or other fees, which will affect actual investment performance. Individual investor's results will vary. Past performance does not guarantee future results. Future investment performance cannot be guaranteed, investment yields will fluctuate with market conditions. The S&P 500 is an unmanaged index of 500 widely held stocks that is generally considered representative of the U.S. stock market.

