Falling Back

Last week had a ton of earnings, a Fed rate cut (mostly expected), a bunch of monsters knocking on my door for candy, all culminating in an hour’s extra sleep over the weekend. I’m not sure whether it’s just me, but things feel a little bit different in November than other months. Maybe I’m getting my annual dose of dopamine from the weather cooling down, while surf temperatures are still warm here in Florida. Or maybe it’s the holidays approaching, revolving around family, food, and sports. Whatever it is, I just love this time of year. The industry term for this is cyclicality. I guess it applies to life as well.
I’ve had the team here working on some research recently, to prove or disprove some commonly thought theories. First, we looked to see if we could find a correlation between stock market performance and political parties. I know this is a touchy subject for most, so I’ve attached the data at the end, however, here are a couple of highlights.
Presidential Terms
The third year of a president’s term (for both parties), has been positive 91% of the time, with the average return being 17.8%. Further, there has only ever been 2 negative quarters in the 3rd year of a Presidents term, which was under Hoover, during the midst of the great depression and FDR’s second term. Meaning we have not had a negative stock market return in the 3rd year of a president’s cycle for 80 years.
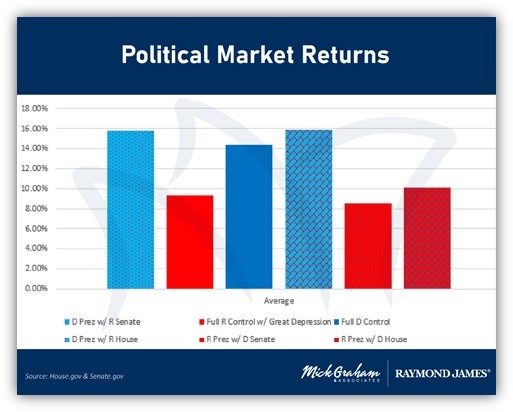
Markets under democratic presidents have averaged 13.5% while republicans have averaged 7.7%.

Source: S&P 500 & MG&A
However, the best returns for democratic presidents come when either the house or senate is controlled by Republicans, returning an average of 15.89% and 15.82% accordingly.

When one party controls all three branches of government the average return is higher than the average of the S&P 500. (Starting from the end of the great depression).
Market Price v Earnings per Share
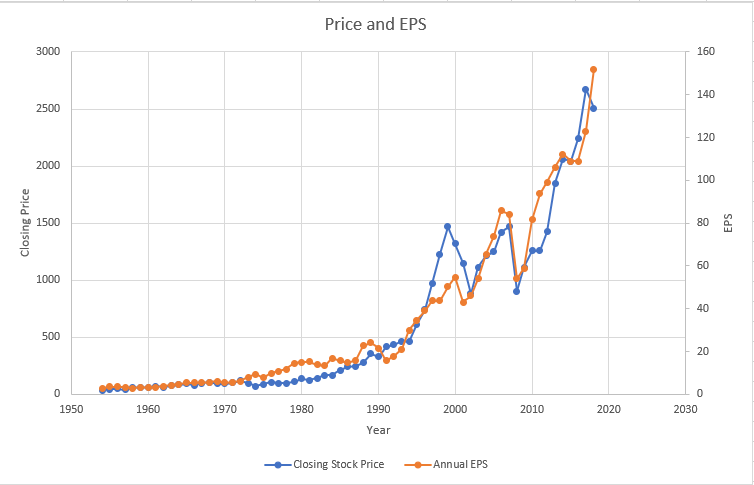
I’ve said for years, that it “all comes back to earnings”. This was based on my experiences since I started following the markets 25 years ago. We recently back dated the data to see if there was in fact some correlation between stock market returns and earnings. The graph below should visualize this for you.

Source: Raymond James
I think Forrest Gump says it best, Earnings per Share (EPS) and stock market returns, “are like peas and carrots”.
Multiples
Another “Mickism”, is that the multiples we pay for the S&P 500 should be going up incrementally because we continue to get more growth orientated companies in the index than before. Most of the data or charts I’ve seen will give you the average of the last 25 years or so, however that doesn’t make sense to me. We’ve been adding 0.0833 to the multiple each year on average since 1950. I calculate that if we stay on the same progression that the average multiple will be 21.91.

Source: MG&A
How’s all this set up for the next few years? I have Earnings growth slowing (not retracting), which will mean I expect the markets to return positive returns looking forward a couple of years, albeit at a slower pace than we have seen in the past few years. Vigilance is needed from this point to measure were we are against the mean and make moves accordingly.
With that, here is the Buy/Sell

Source: MG&A

Any opinions are those of Mick Graham and not necessarily those of RJFS or Raymond James. The information
contained in this report does not purport to be a complete description of the securities, markets, or developments referred to in this material. There is no assurance any of the trends mentioned will continue or forecasts will occur. The information has been obtained from sources considered to be reliable, but Raymond James does not guarantee that the foregoing material is accurate or complete. Any information is not a complete summary or statement of all available data necessary for making an investment decision and does not constitute a recommendation. Investing involves risk and you may incur a profit or loss regardless of strategy selected. The S&P 500 is an unmanaged index of 500 widely held stocks that is generally considered representative of the U.S. stock market. Keep in mind that individuals cannot invest directly in any index, and index performance does not include transaction costs or other fees, which will affect actual investment performance. Individual investor's results will vary. Past performance does not guarantee future results.

