Milestones

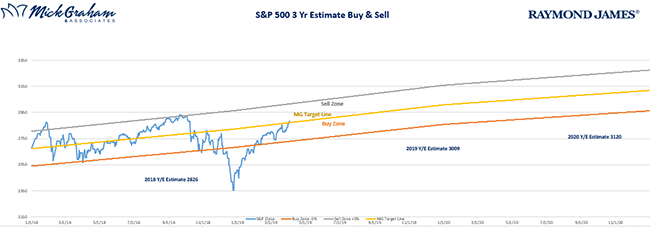
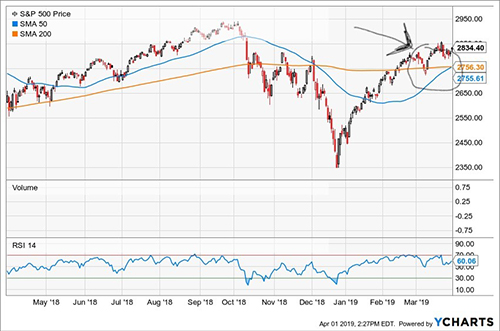
Last week we had a couple of technical milestones. First our Buy/Sell graph hit fair market value, for the first time since October of last year. Second, the 50-day moving average crossed the 200-day moving average, which is commonly known in the technician’s world as the “Golden Cross”.
A quick recap – Technical analysis is the study of charts and attempting to determine the future direction of an index or stock based on patterns. Technical analysis does not look at the underlying themes or for that matter the name of the index or security, to make a prediction on the future. Just purely trading patterns.
As you know, the buy/sell chart we put together every day is a visual representation of where I think the market is today, compared to where I believe it should be. The fair value assumption is based on what I predict corporate earnings will be at year end, and from there I place a multiple of those earnings.

It takes something fundamental to change my forecasts once I have made them. The last time I made a change was after the tax reform legislation was passed into law. That law reduced the corporate tax rate from 35% to 21%, and such left a lot more profits on the balance sheets of corporations. Therefore, my earnings forecast went up. Predicting the multiple you pay for those earnings can be even trickier. You can use a long-term average of the market; however, I tend to move them around based on economic conditions. In a period where growth is expected, you can warrant paying a higher multiple. If the economy is contracting, then you would not want to pay as much.
Last week’s crossing of the fair value, was not a matter of being right, because the market doesn’t work that way. Ken Fisher calls the market TGH, “The Great Humiliator”, and I think that’s the best description I’ve heard. Every time you think you have all the data to make a prediction, the market can make you look silly. This graph has served me well. However, for the past decade, as I mainly use it to describe when we should be considering buying and when we should look at selling. Human nature (and our prehistorical survival instinct) want us to do the opposite. It helps take some of the emotion out of it for a lot of clients.
Buy/Sell

Source: MG&A
Now…The Golden Cross. This is when a short term moving average crosses over a longer term. The most commonly followed average is the 50-day moving average and the 200-day moving average.

A Golden Cross occurs after the shorter average (in this case the 50-day moving average, crosses over the 200-day moving average). It’s rare and is a bullish sign for most pundits. The thesis behind it is “a rising tide lifts all ships”. Most technicians will tell you this is one of the strongest buy signals you can experience. Remember though, it must cross to the downside first, which means you probably just had a miserable time.
The opposite of the Golden Cross (or what happened last December) is called the “Death Cross”. Again, using the chart above you can see that if you were able to reduce some risk after the Death Cross, you saved yourself some anguish.
The only thing I can say here is that technical analysis is 100% right after the fact…Sort of like Monday morning quarterbacking. For instance, if we didn’t have the near 20% pull back into December 24th last year, we wouldn’t have the Golden Cross now. I do however pay attention to history and statistics. In the last 10 years, we have had 6 Golden Crosses on the S&P 500, here are the results;
| Date | % Return following 3 months |
| June 22, 2009 | 20.0% |
| October 22, 2010 | 8.48% |
| January 31, 2012 | 6.51% |
| December 22, 2015 | 0.53% |
| April 22, 2016 | 3.99% |
| April 1st, 2019 | ??? |
| Average | 7.90% |
Now no one can tell you what the market will do in any day, week, month or even year(s), however I do enjoy finding periods that have historically out performed others. With that said, we won’t be making any radical changes in portfolios…in fact now is the time I think to rebalance and ensure you’re not overexposed to risk. Although I still feel like this bull market has some legs left in it, I’m also aware that we are closer to the end than the beginning.
In summary, technicals alert me of things worth further review.
Any opinions are those of Mick Graham and not necessarily those of RJFS or Raymond James. The information contained in this report does not purport to be a complete description of the securities, markets, or developments referred to in this material. There is no assurance any of the trends mentioned will continue or forecasts will occur. The information has been obtained from sources considered to be reliable, but Raymond James does not guarantee that the foregoing material is accurate or complete. Any information is not a complete summary or statement of all available data necessary for making an investment decision and does not constitute a recommendation. Investing involves risk and you may incur a profit or loss regardless of strategy selected. The S&P 500 is an unmanaged index of 500 widely held stocks that is generally considered representative of the U.S. stock market. One cannot invest directly in an index. Past Performance does not guarantee future results. Rebalancing a non-retirement account could be a taxable event that may increase your tax liability.

