“Homer”nomics

The past week reminded me of an episode of The Simpsons. One particular episode, where Homer jumps on the old-style scale and as the scale is trying to find his weight, Homer yells “Doh, Wahoo, Doh, Wahoo….”
I don’t do it justice. Click here for the audio.

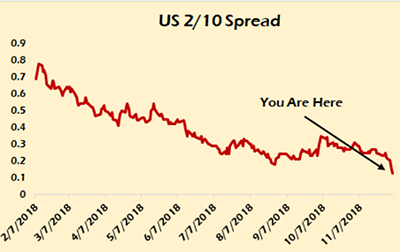
Over the weekend prior news of an intended deal pushed the Dow up 400 odd at the open, then Tuesday’s complete hemorrhage, and what followed. The culprit being reported are split between the 2 – 10-year treasury spread being the lowest it’s been all year, and that the trade deal being reported is far from done.
The 2-10-year spread. This is the difference in yield between the 2-year Treasury and the 10-year treasury. Early last week the spread came into the lowest level they have been in some time.


Source lewrockwell.com
Why is this a concern? If you listen to the talking heads, they will tell you that an inverted yield curve (when short term rates pay more than longer term rates) is a sign of a recession, and in essence, they are correct. When a yield curve inverts, it’s bad for banks. Banks in their simplest form, make money by borrowing short term and loaning long term. Therefore, the higher the spread, the more money to be made by lending institutions. The more money made by banks, the more they want to lend, and the easier money is to get. If they’re not making money, they restrict the money supply and that makes an economy slow.
I’m definitely not saying this time is different, rather I prefer to look at the global yield spreads and global yield curve to see if in essence we are hitting headwinds. My argument is that in today’s global economy when $5.1 Trillion is transacted globally each day (according to a businessinsider.com report), and the ease in which the global financial companies can access credit across the globe, the better curve to look at is global. To make a simple graph, I averaged the 2- and 10-year government bonds of a number of economies including the U.S. and the 2-10 spread is 0.933.

Source: ThomsonONE Eikon as of 12/6/2018
The spread has narrowed globally somewhat but not to a point that I believe triggers any major concerns.
On the trade front, this won’t be an easy negotiation. You have Chinese pride that will not allow another country to dictate to them, and the U.S. trying to reverse a long period of trade deficit. It’s not in either country’s long-term interest to place barriers against trade, so this won’t be a quick or easy negotiation and as a result I feel you’ll see more volatility in the overall market due to this.
All in all, I’m still not seeing anything that is leading me to change my thinking of long-term bull market, with a normal correction. I know I’m a broken record, but we are all playing the long game.
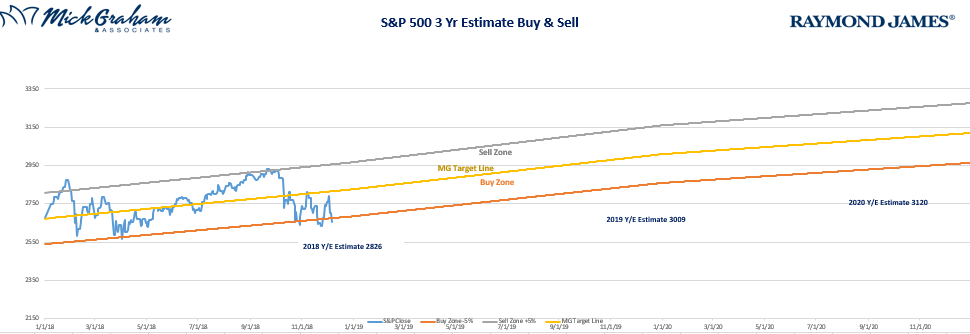
Here’s the buy sell

Source: MG&A
Feel free to call with any questions or concerns.
Every investor’s situation is unique and you should consider your investment goals, risk tolerance and time horizon before making any investment. Prior to making an investment decision, please consult with your financial advisor about your individual situation. The foregoing information has been obtained from sources considered to be reliable, but we do not guarantee that it is accurate or complete, it is not a statement of all available data necessary for making an investment decision, and it does not constitute a recommendation. Any opinions are those of Mick Graham and not necessarily those of Raymond James.

