Earnings & 2020 Estimates

Prior to the major drop last week of most of the stock market indexes, I was finishing up my work for my 3-year forecasts for the S&P 500. As you know, I created what we call the Buy/Sell to give a visual slide of whether the market is cheap or expensive based on the earnings of companies within the index.
Earnings are the real key to the price of the stock market. Daily movements come from many forces, however ultimately the stock market is priced as a multiple of earnings. Do I sound like a broken record yet?
The long-term multiple average of the S&P 500 (going back 60 odd years) is around 15.4 times earnings. I’ve written previously that I believe multiples should be higher (click here for article), however more recently we lifted our multiple number given the effect of expected tax reform to 19 times 2018’s earnings of $157.
That figure of $157 per share was roughly a 20% jump over the previous year’s earnings, (a huge jump) that benefited from a corporate tax rate being lowered to 22% from 35%. Looking forward, it’s unrealistic to think we will get that kind of jump; however, I do believe the next two years should give us around 10% growth. For 2019 I estimate earnings will come in at $177 per share and for 2020 $195.
As far as multiples, I’m lowering our 2018 multiple to 18 times, 2019 to 17 times and 2020 to 16 times, which makes a retraction to the long-term average of 15.4.

|
Year |
Earnings |
Multiple |
S&P Forecast |
|
2018 |
$157 |
18 |
2826 |
|
2019 |
$177 |
17 |
3009 |
|
2020 |
$195 |
16 |
3120 |
See how this graphs out below.
For the rest of 2018, my fair value model based on earnings shows a 6.4% increase from here.
2019 – Shows another 6.4% return from my fair value of 2826
2020 – Is only showing a 3.6% return from my fair value of 3009
Now the likelihood of my estimates hitting are low, but the longer I go out the closer it will be, purely based on how stock market returns become more predictable with time, as the chart below shows.
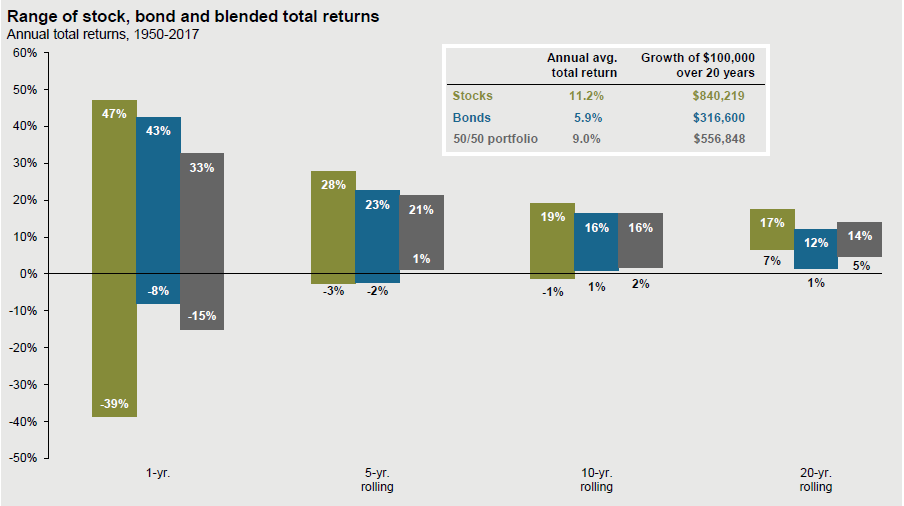
Source: JP Morgan
What does all this mean as we move forward? At some point through the next couple of years I expect the actual return of the market to hit both my buy line (as it is today) and the sell line. It’s at that those times when we can attempt to lower our cost basis in some of the positions we own.
As for the fixed income (bond) market, at some point the returns on bonds will become attractive especially considering my measly 3.6% return for the market in 2020. It’s been a long time since we’ve said that bonds offer a more attractive return than stocks, but that day will come if rates continue to rise.
As for the current market, when you have fundamentals (like corporate earnings) hitting or exceeding their estimates and people creating big fears of little things, that’s a bullish sign. Last week was the busiest week of 3rd Quarter earnings with 154 companies in the S&P 500 reporting. This week we will have 128 companies report. It tells me a lot when we see so much volatility in the market and earnings not driving it.
I know I keep saying it, however this type of volatility is normal. We’ve just been spoiled in the past few years.

Here’s the NEW buy sell
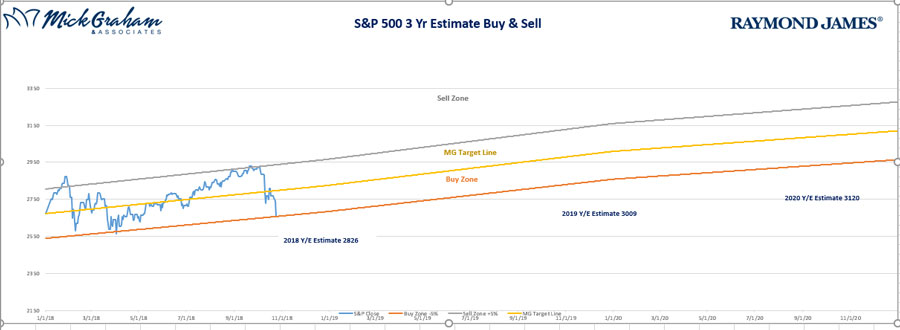
Source: MG&A
As always should you have any questions or concerns, feel free to give me a call.
Any opinions are those of Mick Graham and not necessarily those of RJFS or Raymond James. The information contained in this report does not purport to be a complete description of the securities, markets, or developments referred to in this material. There is no assurance any of the trends mentioned will continue or forecasts will occur. The information has been obtained from sources considered to be reliable, but Raymond James does not guarantee that the foregoing material is accurate or complete. Any information is not a complete summary or statement of all available data necessary for making an investment decision and does not constitute a recommendation. Investing involves risk and you may incur a profit or loss.
regardless of strategy selected. The S&P 500 is an unmanaged index of 500 widely held stocks. It is not possible to invest directly in an index.
