Ring the Bell, Bang the Drum

Over the course of the past 15 years I’ve heard the following comment, “Stocks seem uncertain now, I’ll just wait till things settle down before I’ll make my move.” I’ve heard this in up markets, down markets and flat markets. This thought from investors is probably more normal than not. Investing for the retail investor is emotional. We all look at down days and see the balance drop and equate it to something we could have bought, or a trip we could’ve taken or the college tuition we could have paid for.
What we are really saying here is that we don’t like volatility, and we will wait till it evens out. Trouble is if we wait for that you could wait forever. No one rings the bell at the top and no one will beat the drum at the bottom. Financial theory is quite clear in this area. You can’t get much return without risk or volatility. When you purchase an historically lower volatility asset class you are generally giving up return.

Source: JP Morgan
Returns shown are based on calendar year returns from 1950 to 2017. Stocks represent the S&P 500 Shiller Composite and Bonds represent Strategas/Ibbotson for periods from 1950 to 2010 and Barclays Aggregate thereafter. Growth of $100,000 is based on annual average total returns from 1950 to 2017.
Looking at the graph above can give you the shivers. In any one year (based on the last 70 years of data) the stock market can be down 39% and up as much 47%. What I want you to pay attention to is that the longer you go out the more predictable your returns can be. When you go out 5 years you can see a balanced portfolio (50% stocks & 50% bonds) has provided a positive return in each of the 5-year periods dating back to 1950.

That can lead you to say, “well why don’t I sell out when I feel like the market is about to turn down and get back in when it looks like going back up?” Sounds like a good strategy, right?? Trouble is firstly, I’ll refer you to my comment above on the bell and the drum. Second, many have tried this and been made to look silly, if there is anyone out there who can accurately time the market then I’d like to meet them. Third and this is the most important point, as counterintuitive as it sounds, market risk is the least when fear is at its highest. When everyone thinks that the world is coming to an end, and sentiment is in the toilet, it can signal that the market is bottoming. Now the opposite is also true.
Below is a stat chart that I like to show investors who tell me that they are waiting for a better time to enter the market. It shows you what the relative asset classes have returned over the past 20 years. Just slightly above inflation you will see the retail investor.
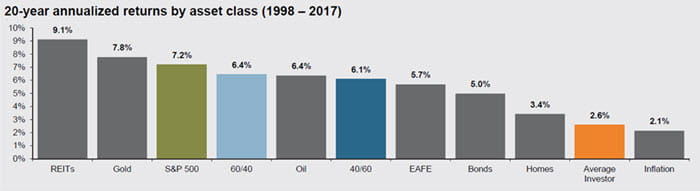
Source: JP Morgan
Indexes used are as follows: REITS: NAREIT Equity REIT Index, EAFE, MSCI EAGE, Oil: WTI Index, Bonds: Barclays U.S. Aggregate Index, Homes: median sale price of existing single-family homes, Gold: USD/troy oz., Inflation: CPI. 60/40: A balanced portfolio with 60% invested in S&P 500 Index and 40% invested in high quality U.S. fixed income, represented by the Barclays U.S. Aggregate Index. The portfolio is rebalanced annually. Average asset allocation investor return is based on analysis by Dalbar Inc., which uses the net of aggregate mutual fund sales, redemptions and exchanges each month as a measure of investor behavior. Returns are annualized (and total return where applicable) and represent the 20-year period ending 12/31/16 to match Dalbar’s most recent analysis.
There are many reasons for this, including fees, however emotional investing is one of the main culprits. That’s what I call investing outside your personal investment policy statement. Yes, to get returns like an institutional investor, you need to invest like them and remove as much emotion as you can and follow what your plan tells you is the appropriate amount of risk. Rebalance accordingly throughout both bull and bear markets to ensure your exposure to each asset class stays consistent.
In summary, your gut may give you a good guide on first impressions, however can cost you dearly in the investing world.
If you do not have a financial plan that specifies the appropriate asset allocation for your portfolio, then feel free to give us a call and we would be happy to put one together for you.
Opinions expressed are those of Mick Graham and are not necessarily those of Raymond James. Investing involves risk and investors may incur a profit or a loss. The information contained in this report does not purport to be a complete description of the securities, markets, or developments referred to in this material. It has been obtained from sources considered to be reliable, but we do not guarantee that it is accurate or complete. This information is not a complete summary or statement of all available data necessary for making an investment decision and does not constitute a recommendation. There is no assurance of any of the trends mentioned will continue or forecasts will occur. All investing involves risk and you may incur a profit or a loss. Asset allocation and diversification does not ensure a profit or protect against a loss. Past performance does not guarantee future results. There is no assurance that any strategy selected will be successful. Dividends are not guaranteed and a company’s future ability to pay dividends may be limited.
The NAREIT EQUITY REIT Index is designed to provide the most comprehensive assessment of overall industry performance, and includes all-tax qualified real estate investment trusts (REITs) that are listed on the NYSE, the American Stock Exchange or the NASDAQ National Market List. The MSCI EAFE Index (Europe, Australasia, Far East) is a free float-adjusted market capitalization index that is designed to measure the equity market performance of developed markets, excluding US & Canada. The Barclays Capital US Aggregate Corporate Index (BAA) is an unmanaged index composed of all publicly issued, fixed interest rate, nonconvertible investment grade corporate debt rated BAA with at least 1 year to maturity. The S&P 500 Index focuses on the large-cap segment of the market; however, since it includes a significant portion of the total value of the market, it also represents the market.
Keep in mind that individuals cannot invest directly in any index, and index performance does not include transaction costs or other fees, which will affect actual investment performance. Individual investor’s results will vary. Past performance does not guarantee future results.
