Little Things - Big Fear
I never cease to be amazed at the dooms dayers that flood the business media each day. Tariffs and Yield Curve are the flavor of the week. Now I get that there is a reason why tabloids exist, and more people will watch a train wreck than a good news story, however sometimes we miss the fundamentals, and therefore, I say Big fears of little things is Bullish.
The Financial Media has accurately predicted the last 27 of the last 5 recessions. (Ha)
Let’s look at both current issues. On the yield curve, there is merit around the fact that when the yield curve inverts, it’s a sign of a slowing economy (even a recession). I believe that when considering this as a barometer, there are two things that you need to look at. First, you must pay attention on how you got to inversion. If the yield curve inverts due to short rates going up, and long rates staying put (as we have now), this is far less bullish than long rates coming down and short rates trying to keep up. As I’ve written before, the Fed controls the short end of the yield curve and the free market controls the longer end. Good economic numbers force the fed to raise rates to put the brakes on the economy by raising the Fed Funds rate, which is also known as the overnight rate. The cost of borrowing for financial institutions.
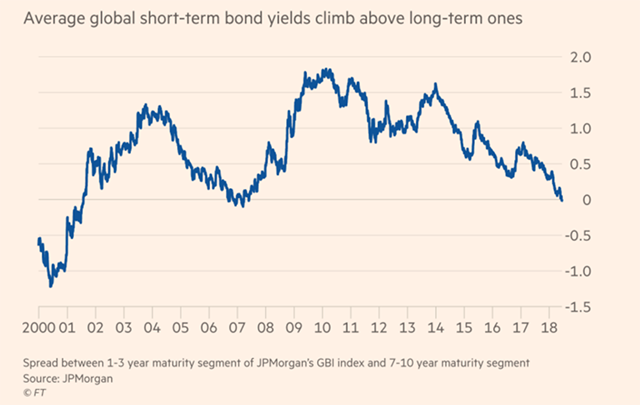
Second point on the yield curve is that when the financial pundits talk about an inverting yield curve, they are referencing the U.S. yield curve. It’s a Global Market today. Individuals, Corporations & Governments transact on an international basis, so I would suggest to you that when looking for an inversion on a yield curve then look at the Global Yield curve. To make profits, corporations will go (borrow or transact) where there is money to be made, and today it’s much easier to do than any time in history.
 Now to Tariffs. Let’s look at the worst-case scenario. (I do this a lot) From what I have found so far with $10 Billion of Solar panels, $40 Billion of steel, $200 Billion on cars, $250 Billion of Chinese Goods and around $130 Billion of Chinese retaliation and another $20 Billion for EU/Canadian and Mexican retaliation. That’s $650 Billion. If we put the highest figure quoted thus far 25% on all $650 Billion that’s $162.5 Billion. As one of my modern-day heroes Ken Fisher points out— that’s a huge number, but when you compare it to Global GDP (which was $80 Trillion in January, growing at 5%) it’s put back into perspective. $4 Trillion of Global GDP growth and $162.5 Billion of Tariffs, that totals 4% of 2018’s growth.
Now I don’t believe we will see $650 Billion on tariffs imposed, nor do I think that the full 25% will be imposed. Nor do I think much of the tariffs will be collected, as countries can buy through third parties to skip the tariffs all together. By that I mean the tariffs that would be imposed can be missed by buying through a country that does not have any imposed tariffs, and you may end up paying a bigger transaction cost through a middleman but save on the tariff that would have been imposed. The free market will work that part out.
The point I’m trying to make here is that Big Fears of Little Things is a Bullish sign. From what I am hearing there are Big Fears, and in my opinion the yield curve and tariffs are not factually big things.
Here’s the buy sell
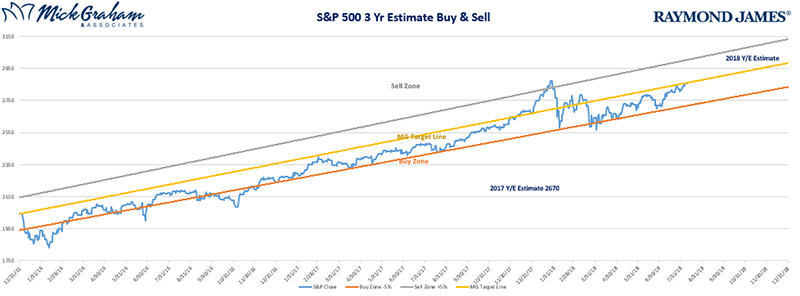
Source: MG&A
As always should you have any questions or concerns please don’t hesitate to contact us.
Any opinions are those of Mick Graham and not necessarily those of RJFS or Raymond James. The information contained in this report does not purport to be a complete description of the securities, markets or developments referred to in this material. There is no assurance any of the trends mentioned will continue or forecasts will occur. The information has been obtained from sources considered to be reliable, but Raymond James does not guarantee that the foregoing material is accurate or complete. Any information is not a complete summary or statement of all available data necessary for making an investment decision and does not constitute a recommendation. Investing involves risk and you may incur a profit or loss regardless of strategy selected. The S&P 500 is an unmanaged index of 500 widely held stocks that is generally considered representative of the U.S. stock market.
