Back to Earnings
Last week was a big week in earnings with a lot of the banks reporting. It was interesting due to the numbers for these banks beating estimates, yet the stocks did not move to the upside. Digging through some of the reports, the decline in stocks was related to lower net interest income mainly due to the lower long-term bond yields.
Yield curve is a common term discussed in the investment industry and this is how banks make money. They loan long term and pay short term. The graph below is an example of what some analysts feel the curve will look like, basically saying the long-term rates won’t move that much (this is called a flattening yield curve). Just as a reminder, the Fed controls short term rates and the market directs long term rates.
Treasury Yield Curves
As for the overall market, we still feel that the path of least resistance is upwards. I’m sure there will be some short-term decline driven by some headline risk, however our thesis is that we are early in the second half of this rally.
Our strategist Jeff Saut argues, “Then too we are not so sure pundits should be measuring the start of the secular bull market from the ‘nominal low’ of March 2009. To be sure, nobody measured the 1982-2000 secular bull market from the ‘nominal low’ of December 1974, but rather from when the market broke out above the 1966-1982 trading range in late 1982. That implies the right starting point for this secular bull might just be April 2013, when this market broke out of the 2000-2013 trading range.” (Source: Raymond James Morning Track, July 11, 2017)
![]()
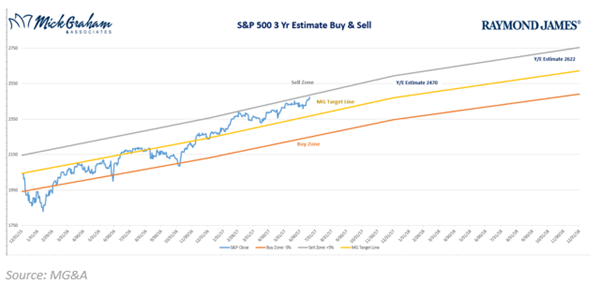
Our Buy/Sell is getting up toward the top 5% above our fair value number. If it touches it will be the only time in the past years. Wednesday’s rally pushed the S&P 500 through our year end number. I’ve had a few people ask me what I plan on doing now that it’s at that level, wondering if my advice is to sell or reduce our equity exposure. If we do this, it will be on an individual basis and not across the board. We hold the right to move our year end estimate based on how earnings come in along with the multiple those earnings. Earnings overall so far are coming in line with our estimates. As you have no doubt heard “the markets overshoot both on the upside and down”, and this creates opportunity.
As we wait to see if anything can ever get passed in Washington, we still have a premium on multiples based on a pro-growth agenda. It’s obviously easier said than done.
More earnings calls this week. Keep an eye out for your quarterly reports. As always feel free to call with any questions.

Inclusion of these indexes is for illustrative purposes only. Keep in mind that individuals cannot invest directly in any index, and index performance does not include transaction costs or other fees, which will affect actual investment performance. Individual investor’s results will vary. Past performance does not guarantee future results. The S&P 500 is an unmanaged index of 500 widely held stocks that is generally considered representative of the U.S. stock market.
