Expensive???
![]()
Since I last wrote we have witnessed some dramatic moves in tech stocks and I’ve fielded many questions asking whether these stocks are in bubble territory, namely the FANG stocks (Facebook, Amazon, Netflix & Google). I don’t think that is the case…
Apart from a point that I’ve been making for a while now, namely that I feel valuations should be higher than historical averages (due to more growth orientated stocks in the index, and a greater amount of sales coming from intangibles than tangibles), I like to look at not only the P/E ratios but PEG ratios.
As you know P/E (Price / Earnings) has been a commonly used reference point by investors. Simply the price of the stock divided by the annual earnings of the stock, gives you a reference point of whether a stock is expensive against other stocks in the same sub-sectors. The average of the S&P 500 P/E according to our analyst Jeff Saut is 23.85 when you take out low P/E companies in the 70s and 80s which were driven by double digit inflation and interest rates.

PEG takes the P/E ratio and divides that by annual Earnings per share growth (EPS growth). Growth rate is expressed as a percentage, for instance if a company has a 30 P/E, and a 30% growth rate then the PEG ratio would be 1. According to seekingalpha.com the average PEG ratio of the S&P 500 was 3.37.
In Jeff’s note this week he highlighted the valuations of the FANG stocks. Facebook is trading at 25 P/E but is at a PEG ratio of less than 1, Google 22 P/E and a PEG of 1.4 and would be lower if you back out the share based compensation.
“It all comes back to earnings” and PEG can be a good indicator to show that. Now there are many critics about the PEG ratio, however for this article I wanted to highlight that there is more than just a P/E when valuing a company, particularly companies that are growing.
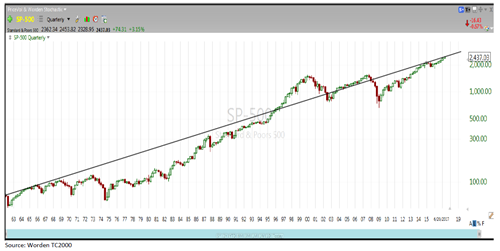
A couple of charts that looked interesting were from a Raymond James Advisor in Cincinnati that showed a chart dating back to 1934. Our research group published it under the title “Talk about a Long-Term Trend”.
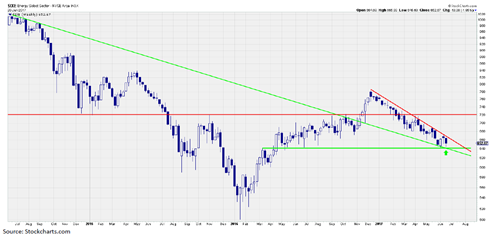
Energy stocks still disappoint as crude dropped to 10 month lows. I did notice that some of the midstream MLPs have been caught up in this price drop and shouldn’t be as sensitive to oil prices, and have some dividends that can cushion some further downside.
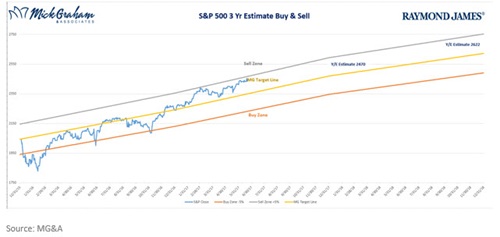
The buy/sell this week has been flat over the past couple of weeks despite some sector moves. Still slightly above our mean line.
As always should you have any questions feel free to reach out.

Past performance may not be indicative of future results. It is not possible to invest directly in any index. The S&P 500 is an unmanaged index of 500 widely held stocks. Companies engaged in business related to a specific sector are subject to fierce competition and their products and services may be subject to rapid obsolescence. There are additional risks associated with investing in an individual sector, including limited diversification. Investments in the energy sector are not suitable for all investors. Further information regarding these investments is available from your financial advisor. Price Earnings Ratio (P/E) is the price of the stock dividend by its earnings per share. Information provided is general in nature, and is not a recommendation or a solicitation to buy or sell any security. Investments and strategies mentioned may not be suitable for all investors. Investing in stocks involves risk, including the possibility of losing one’s entire investment.
