Can We Live in a 2% Growth Rate? It’s the New Norm
![]()
There’s a lot that has been written and spoken about regarding the U.S. economic growth rate. According to the U.S. Commerce Department averaged 3% since the second world war. Since the financial crisis growth has been extremely slow, as the economy was flooded with liquidity to stop the bleeding and get back to what is called “normalized growth”.
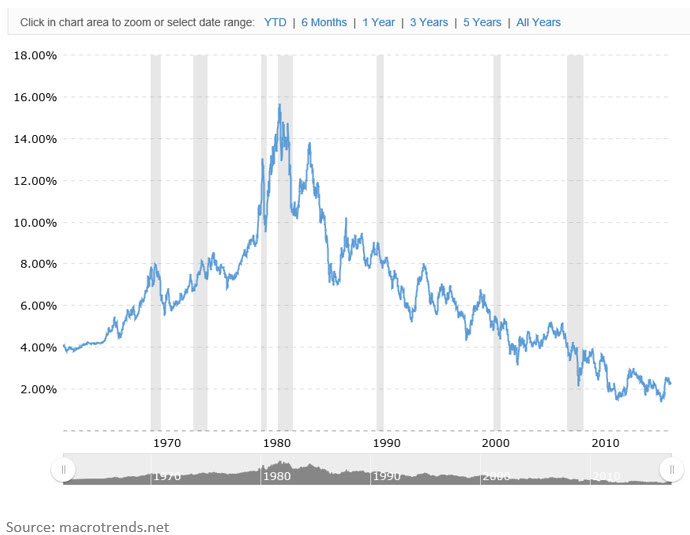
The result of what has happened is that we have seen jobless claims and unemployment levels down to the lowest levels since May 2007 according to tradingeconomics.com, however we have not seen is that equate into sustainable GDP growth. Interest rates struggle to move higher, with the 10 year back to 2.28% as of the time of writing. As I’ve written in the past, the Fed controls the short end of debt (Fed Funds Rate) however, the free market dictates the longer end of the curve like the 10 year and beyond.
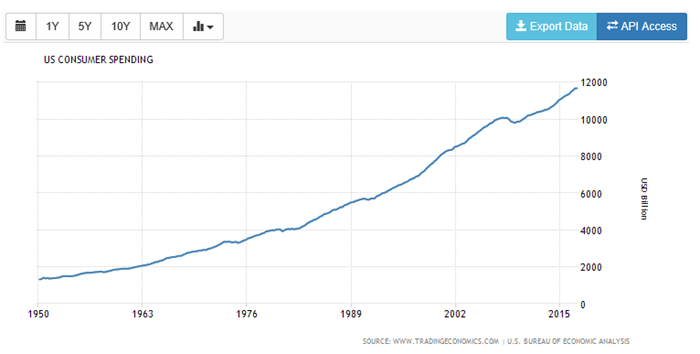
Ultimately low rates are an encouragement for consumers and business to spend to get the economy going. The U.S. consumer has continued to spend getting up to 11,769 Billion in the first quarter of 2017, and the U.S. consumer equates to over 7-% of US GDP, according to the U.S. Bureau of Statistics.
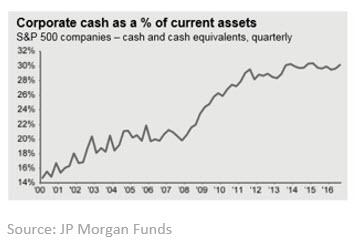
What we have not seen is capital going back to the markets from business. The levels of corporate cash are still at all-time highs, as I feel CEOs are waiting for some clarity on an array of policy decisions.
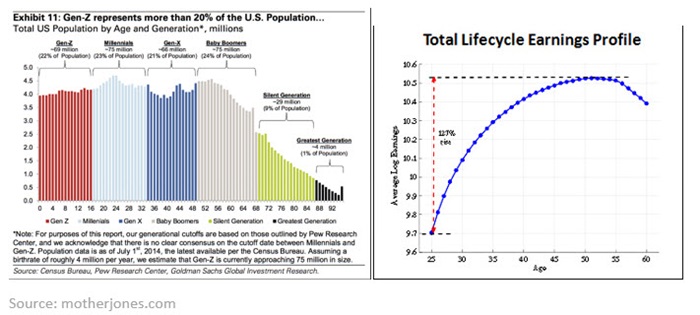
What does all this mean? I believe that 2% will be the new norm for some period. Consumer spending has been historically driven by those in the age of maximum earnings which is early 50s according to MarketWatch. If you look at the chart below we are about to head into a 15-year period of the Gen X generation to hit the maximum earnings, and that demographic is around 9 million less than the Baby Boomers. So, unless the generation is earning that much more (adjusted for inflation) than the boomer generation then we may be in for a slowing of the consumer spending growth, in my opinion.
The good news though, I believe, is that we continue to see markets can continue to do well in a U.S. 2% growth environment for several reasons but here is the top few:
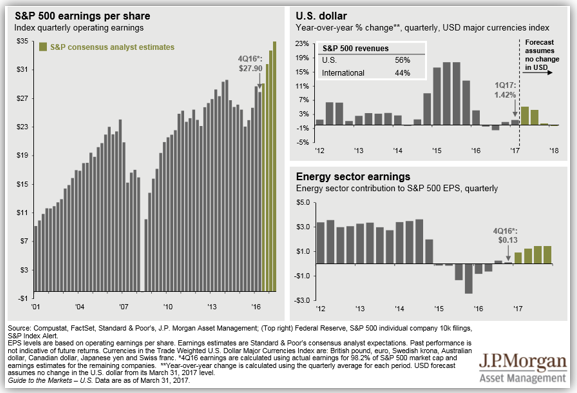
- The rest of the world is growing faster than the U.S. and the S&P 500 gets approximately 50% of its sales from outside the U.S. (according to S&P).
- Earnings growth is back, according to FactSet, with 95% of earnings in for Q1, the blended S&P 500 earnings growth will be 13.9%, and will mark the best year over year since 2011.
- I feel Equities are still the best asset class to be in looking out over the next 10 years, comparing to bonds, commodities and real estate.
Inclusion of these indexes is for illustrative purposes only. Keep in mind that individuals cannot invest directly in any index, and index performance does not include transaction costs or other fees, which will affect actual investment performance. Individual investor’s results will vary. Past performance does not guarantee future results. The S&P 500 is an unmanaged index of 500 widely held stocks that is generally representative of the U.S. stock market.
Here is the Buy/Sell for this week

As always should you have any questions please don’t hesitate to call.

Any opinions are those of Mick Graham and not necessarily those of RJFS or Raymond James. The information contained in this report does not purport to be a complete description of the securities, markets, or developments referred to in this material. There is no assurance of the trends mentioned will continue or forecasts will occur. The information has been obtained from sources considered to be reliable, but Raymond James does not guarantee that the foregoing material is accurate or complete. Any information is not a complete summary or statement of all available data necessary for making an investment decision and does not constitute a recommendation. Investing involves risk and you may incur a profit or loss regardless of strategy selected.
