3Q Earnings
I’ve said it many times before “It all comes back to earnings”. Markets move based on many things including political and environmental issues, but in the end the market is a multiple of the earnings its constituents produce.
I’ve also said that we are amid a 20-year bull run for equities. This doesn’t mean that the market will go straight up, but rather will have several macro factors that can be the wind behind the market.
At this stage in the run, I do feel that we are at an inflection point. So far the market has driven higher since the crash mainly due to policy decisions, namely rates. This year I see the market moving into an earnings recovery. As you’ve no doubt heard, earnings growth has been somewhat anemic, and to a certain extent that is correct. However, my expectations moving forward, especially as we get through the election, is that we will see earnings growth that will propel the markets into the second phase of the cycle.
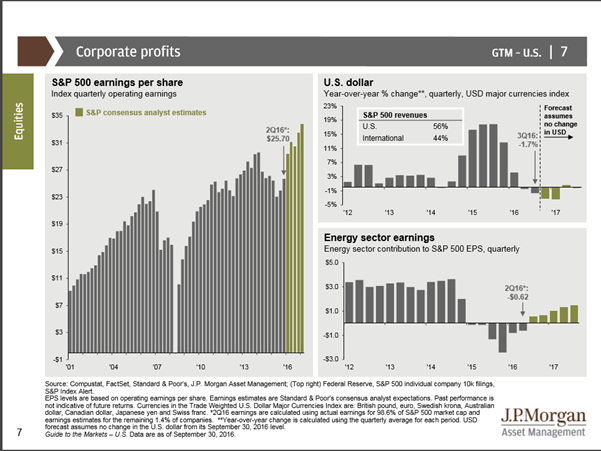
The graph highlights how we expect earnings to increase in the next 6 quarters, to historical highs.
There are many reasons why I have this opinion however at the top of the list is that once we get through the election, (regardless of who takes the Whitehouse or House or Senate for that matter) executives will at least have some clarity on issues that affect capital investment. I believe that companies will make money despite who is in office. Let’s just give the CEO’s some clarity on what the playing field will look like from a tax and regulatory standpoint.
Im not much of a chartist, but rather prefer to look at the fundamentals, however the below chart produced by our Equity Strategist Jeff Saut is compelling. Since the 1929 crash, every time equity markets have broken out to the upside of a multiyear “range bound” chart pattern, we have begun a new secular bull market. There is no reason to believe it is different this time as the markets transition from an interest rate driven market to an earnings driven bull market.
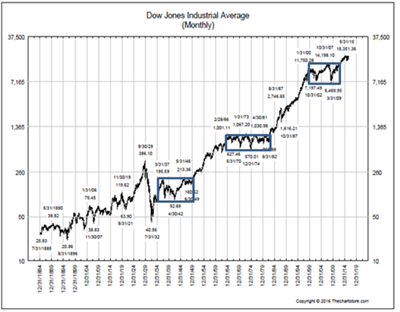
Source: Raymond James Gleanings – September 2016
The next couple of weeks will be spent on earnings calls and sifting through research reports looking for things that can contradict our longer term strategy.
Here is the market graph for this week. As of 10/20 bounced back off our line.
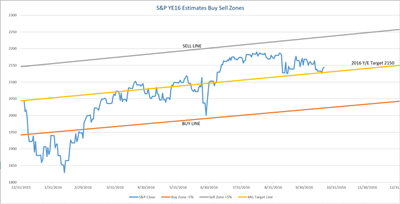
Source: MG&A
As always should you have any questions, please feel free to give us a call.

Any opinions are those of Mick Graham and not necessarily those of RJFS or Raymond James. Expressions of opinion are as of this date and are subject to change without notice. The S&P 500 is an unmanaged index of 500 widely held stocks that is generally considered representative of the U.S. stock market. Inclusion of these indexes is for illustrative purposes only. Keep in mind that individuals cannot invest directly in any index, and index performance does not include transaction costs or other fees, which will affect actual investment performance. Individual investor's results will vary. Past performance does not guarantee future results. Holding stocks for the long-term does not insure a profitable outcome. Investing in stocks always involves risk, including the possibility of losing one's entire investment. There is no guarantee that any statements, opinions or forecasts provided herein will prove to be correct. The information contained in this report does not purport to be a complete description of the securities, markets, or developments referred to in this material. The information has been obtained from sources considered to be reliable, but we do not guarantee that the foregoing material is accurate or complete.
