Fortune Cookie Wisdom
You know a long standing piece of wisdom for investors and portfolio managers is “Buy the Dips”. Since the easing of interest rates following the financial crisis it’s been “Don’t Fight the Fed”. The two now seem locked as one, as we witnessed the biggest one day drop last Friday since the Brexit vote.
It seems each time we get a pull-back that it snaps back just as quick. An interesting statistic from Bespoke Management shown in the Wall Street Journal this week stated that there has been a drop of over 2% in a given day 67 times since March of 2009. Then the following week, the S&P 500 has averaged a 1.3% gain. These figures are a full percentage point higher than the preceding 81 years.
It extends even more when you look at the following month from a pullback. From 1928 to 2009, the average monthly gains after a one day 2% sell off was 0.84%. Since 2009 that average is 3.14%. This Buy the Dip mentality is in full affect and something that I believe will continue to happen while we have fed intervention. June’s Brexit Vote saw a 5.3% drop in a two-day period and that was re-cooped in the following week, and the 11% drop in February took a month to get back.
“Buy the Dips” has in my mind been a good strategy, but one that used to take some confidence. Now days you’d better be quick and if you don’t you’ll be the odd man out. Any time it seems too easy is when I get worried. My point here is that I believe volatility is coming, when the fed starts to exit the market, and we need to ensure we don’t get caught into the trap of just following the herd. This is going to be one of those market events that creates opportunity for long term investors who are looking for good quality names, rather than a blanket strategy. Remember the fed raising interest rates is ultimately a statement saying the economy is getting better.

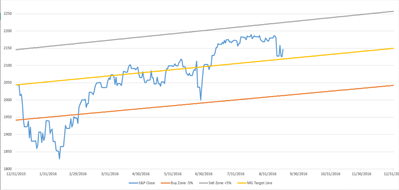
Mick Graham “Buy/Sell Graph through 9/15
As always should you have any questions, please feel free to give us a call
Any opinions are those of Mick Graham and not necessarily those of RJFS or Raymond James. Expressions of opinion are as of this date and are subject to change without notice. The S&P 500 is an unmanaged index of 500 widely held stocks that is generally considered representative of the U.S. stock market. Inclusion of these indexes is for illustrative purposes only. Keep in mind that individuals cannot invest directly in any index, and index performance does not include transaction costs or other fees, which will affect actual investment performance.
Individual investor's results will vary. Past performance does not guarantee future results. Holding stocks for the long-term does not insure a profitable outcome. Investing in stocks always involves risk, including the possibility of losing one's entire investment. There is no guarantee that any statements, opinions or forecasts provided herein will prove to be correct.

