The Week in Review: 11/18/2024
“The distance between insanity and genius is measured only by success” – Ian Fleming
Good Morning ,
Our stock market followed the previous week's impressive surge with some consolidation activity.
The S&P 500 hit another record high on Monday, closing above 6,000 for the first time, but settled 2.1% lower last week. The index is still 1.5% higher since the election results.
Selling focused on chipmakers and mega caps, but losses were broad based.

The equal-weighted S&P 500 closed 1.7% lower than the previous Friday. Only two S&P 500 sectors closed higher last week while eight sectors suffered losses ranging from 1.1% to 5.5%.
The energy (+0.6%) and financial (+1.4%) sectors were the lone standouts in positive territory while the health care sector (-5.5%) registered the largest loss, followed by the information technology sector (-3.2%).
Health care related stocks struggled through the week and exhibited noticeable weakness on Friday after the news that President-elect Trump nominated Robert F. Kennedy, Jr., known as a vaccine skeptic, to lead the Department of Health and Human Services.
Chipmakers were also struggling through the week and exhibited noticeable weakness on Friday after fiscal Q1 guidance from Applied Materials, a leading chip equipment maker, failed to meet the market's more optimistic expectations.
The overall negative bias last week wasn't extreme compared to the previous week's surge, and stemmed from concerns over interest rates and speculation that the Fed may be more cautious with rate cuts than the market previously hoped. The 10-yr yield, which briefly reached 4.50%, settled 12 basis points higher than the previous Friday at 4.43%. The 2-yr yield settled five basis points higher the week before.
This price action was largely related to remarks by Fed Chair Powell indicating that the "economy is not sending any signals that we need to be in a hurry to lower rates."
Last week's data largely corroborated Mr. Powell's comments.
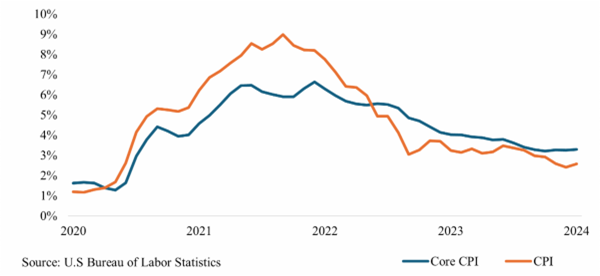
Total CPI was up 2.6% year-over-year, versus 2.4% in September, and core CPI up 3.3% year-over-year, unchanged from September.

Total PPI was up 2.4% year-over-year, versus 1.9% in September, and the index for final demand, less food and energy, was up 3.1% year-over-year, versus 3.0% in September.
Weekly jobless claims remained below recession-like levels, reflecting ongoing strength in the labor market that may translate to higher consumer spending, piling more pressure on inflation. Retail sales were solid in October and the data was stronger than headline numbers suggest due to upward revisions in the September data.
Earnings and the economy remain robust, traders just prefer the news to not be “too good” and give the Fed a reason to pause future cuts.
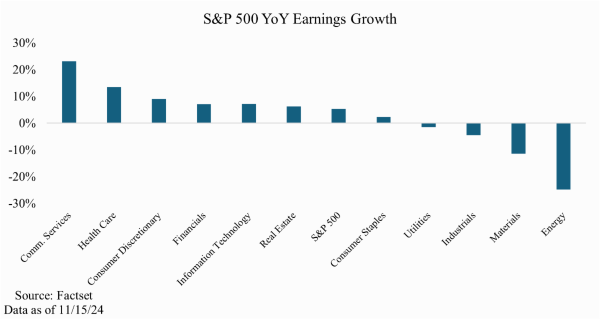
With 93% of S&P 500 companies reporting, the blended year-over-year growth rate is 5.4% for the quarter (source: Factset). With only a few companies left to report, it is likely that earnings growth will remain positive, marking the 5th straight quarter for the index.

The CME FedWatch Tool now forecasts a probability of 58.2% for a ¼ cut at the FOMC Meeting on December 18th, down from 65% a week ago.
There is quite a bit of economic news coming out before the FOMC Meeting, all will be watching closely.
This week will be relatively light for economic news. The highlighted reports will all be on Friday. Manufacturing PMI, Services PMI, and the University of Michigan Consumer Sentiment reports will all be released on this day.
This week we will also wrap up the third quarter’s earnings season. We will hear from Walmart, Lowe’s, NVIDIA, Target, Deere, and Intuit among others. These are important numbers regarding growth and the economy.
While the market took a step back last week, we still believe there will be positive momentum into the end of the year as investors begin to look towards 2025 opportunities.
Have a wonderful week!
Michael D. Hilger, CEP®
Managing Director
Senior Vice President, Wealth Management
The opinions expressed herein are those of Michael Hilger and not necessarily those of Raymond James & Associates, Inc., and are subject to change without notice. The information contained in this report does not purport to be a complete description of the securities, markets, or developments referred to in this material. There is no assurance any of the trends mentioned will continue or forecasts will occur. The information has been obtained from sources considered to be reliable, but Raymond James does not guarantee that the foregoing material is accurate or complete. Investing involves risk and you may incur a profit or loss regardless of strategy selected.
The information contained herein is general in nature and does not constitute legal or tax advice. Inclusion of these indexes is for illustrative purposes only. Keep in mind that individuals cannot invest directly in any index, and index performance does not include transaction costs or other fees, which will affect actual investment performance. Individual investor's results will vary. Past performance does not guarantee future results. The Dow Jones Industrial Average (INDU) is the most widely used indicator of the overall condition of the stock market, a price-weighted average of 30 actively traded blue chip stocks, primarily industrials. The Dow Jones Transportation Average (DJTA, also called the "Dow Jones Transports") is a U.S. stock market index from the Dow Jones Indices of the transportation sector, and is the most widely recognized gauge of the American transportation sector. Standard & Poor's 500 (SPX) is a basket of 500 stocks that are considered to be widely held. The S&P 500 index is weighted by market value, and its performance is thought to be representative of the stock market as a whole. The S&P 500 is an unmanaged index of widely held stocks that is generally representative of the U.S. stock market. Keep in mind that individuals cannot invest directly in any index, and index performance does not include transaction costs and other fees, which will affect investment performance. Individual investor’s results will vary. The NASDAQ Composite Index (COMP.Q) is an index that indicates price movements of securities in the over-the-counter market. It includes all domestic common stocks in the NASDAQ System (approximately 5,000 stocks) and is weighted according to the market value of each listed issue. The NASDAQ-100 (^NDX) is a modified capitalization-weighted index. It is based on exchange, and it is not an index of U.S.-based companies. The Russell 2000 index is an unmanaged index of small cap securities which generally involve greater risks.
U.S. government bonds and Treasury notes are guaranteed by the U.S. government and, if held to maturity, offer a fixed rate of return, and guaranteed principal value. U.S. government bonds are issued and guaranteed as to the timely payment of principal and interest by the federal government. Treasury notes are certificates reflecting intermediate-term (2 - 10 years) obligations of the U.S. government.
The companies engaged in business related to a specific sector are subject to fierce competition and their products and services may be subject to rapit obsolescence. There are additional risks associated with investing in an individual sector, including limited diversification.
Dividends are not guaranteed and must be authorized by the company's board of directors.
Diversification does not ensure a profit or guarantee against a loss.
Investing in oil involves special risks, including the potential adverse effects of state and federal regulation and may not be suitable for all investors.
International investing involves special risks, including currency fluctuations, differing financial accounting standards, and possible political and economic volatility.
The companies engaged in the communications and technology industries are subject to fierce competition and their products and services may be subject to rapid obsolescence.
Gold is subject to the special risks associated with investing in precious metals, including but not limited to: price may be subject to wide fluctuation; the market is relatively limited; the sources are concentrated in countries that have the potential for instability; and the market is unregulated.
The information contained within this commercial email has been obtained from sources considered reliable, but we do not guarantee the foregoing material is accurate or complete.
Any information is not a complete summary or statement of all available data necessary for making an investment decision and does not constitute a recommendation. Prior to making an investment decision, please consult with your financial advisor about your individual situation.
Charts are reprinted with permission, further reproduction is strictly prohibited.
If you would like to be removed from this e-Mail Alert Notification, PLEASE click the Reply button, type "remove" or "unsubscribe" in the subject line and include your name in the message, then click Send.

