
The Week in Review: 6/3/2024
"Energy and persistence conquer all things." ~ Benjamin Franklin
Good Morning,
Markets concluded a strong month in May, but the tech rally took a step back last week following disappointing earnings from Salesforce. Most other sectors followed suit with only Real Estate, Utilities, and Energy sectors posting positive returns for the week.
Mega cap stocks had an outsized impact on index performance throughout the month, especially NVIDIA, which jumped 26.9% in May.
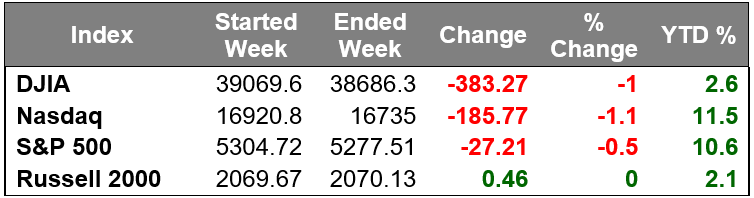
The equal-weighted S&P 500 gained 2.8% this month, versus a 4.8% gain in the market-cap weighted S&P 500. Last week, however, the index logged a 0.5% decline.
The S&P 500 and Nasdaq Composite posted five consecutive weeks of gains, making the month of May one of the best of 2024.
Market participants had a slate of earnings news to get through last week, including from retailers like Best Buy, Foot Locker, Kohl's, and Dollar General.
Dow component Salesforce was a losing standout following disappointing quarterly results, leading Salesforce to close 13.9% lower than the previous Friday.
Earnings, in aggregate are solid…
With 93.0% of S&P 500 companies reporting… 81.3% have beaten consensus estimates, up from 78.3% last quarter.
In other corporate news, ConocoPhillips will acquire Marathon Oil in an all-stock transaction.
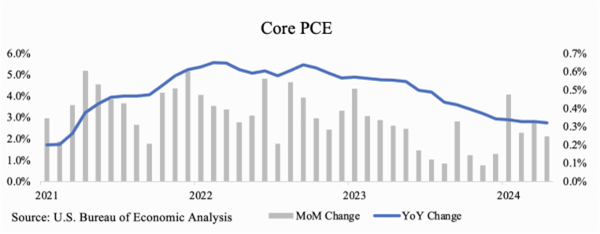
The market also received a mixed batch of economic reports, highlighted by Friday's release of the April Personal Income and Spending report.
The key takeaway from the report is that the year-over-year PCE inflation rates did not worsen; however, they did not improve either. So, it seems unlikely that the Fed would find any new confidence in this report that inflation is moving sustainably toward its 2% target.
Treasuries settled mixed last week in response to the data and in response to some poorly received Treasury sales. Last week's $69 billion 2-yr note, $70 billion 5-yr note, and $44 billion 7-yr note sales met weak demand.
The 10-yr note yield rose five basis points last week to 4.51% and the 2-yr note yield declined six basis points to 4.89%.
Market Snapshot…
- Oil Prices – Oil prices finished out their worst month of the year, ahead of an OPEC+ meeting. West Texas Intermediate crude was down 72 cents, or 1.18%, to $77.99 a barrel, while Brent crude futures were down 24 cents, or 0.29%, to $81.62 a barrel.
- Gold – Gold prices posted a fourth monthly rise on renewed hopes for U.S. interest rate cuts. Spot Gold traded down 0.7% to $2,325.67 per ounce. U.S. gold futures settled 0.9% lower to $2,346.40. Silver finished the week at $30.44.
- U.S. Dollar – The dollar slid after U.S. inflation met April expectations. The dollar index was down 0.1% at 104.62. Euro/US$ exchange rate is now 1.089.
- U.S. Treasury Rates – U.S. Treasury yields rose on Friday as investors considered the state of the economy after digesting the week’s economic data. The U.S. 10-year Treasury yield was up more than 4 basis points at 4.42%.
- Asian shares were up in overnight trading.
- European markets are trading higher.
- Domestic markets are trading in the green this morning.
This week…
This week will feature May’s jobs report on Friday. That and next week’s Consumer Price Index (CPI) report will be the last major economic readings before the Fed makes its next interest rate decision on June 12.
The overwhelming belief is that rates will be held steady at this meeting, but we will be watching for the new Summary of Economic Projections to see how the Fed believes the second half of the year will play out.
March’s report indicated that the Fed was anticipating three rate cuts this year. Recent comments by Fed members and economic reports allude to this being unlikely.
According to CME’s FedWatch tool, the futures market has lowered its expectations and now foresees two cuts this year—one in September and one in December. How inflation behaves over the next couple of months could determine the path for the remainder of the year.
Have a wonderful week!!
The opinions expressed herein are those of Michael Hilger and not necessarily those of Raymond James & Associates, Inc., and are subject to change without notice. The information contained in this report does not purport to be a complete description of the securities, markets, or developments referred to in this material. There is no assurance any of the trends mentioned will continue or forecasts will occur. The information has been obtained from sources considered to be reliable, but Raymond James does not guarantee that the foregoing material is accurate or complete. Investing involves risk and you may incur a profit or loss regardless of strategy selected.
The information contained herein is general in nature and does not constitute legal or tax advice. Inclusion of these indexes is for illustrative purposes only. Keep in mind that individuals cannot invest directly in any index, and index performance does not include transaction costs or other fees, which will affect actual investment performance. Individual investor's results will vary. Past performance does not guarantee future results. The Dow Jones Industrial Average (INDU) is the most widely used indicator of the overall condition of the stock market, a price-weighted average of 30 actively traded blue chip stocks, primarily industrials. The Dow Jones Transportation Average (DJTA, also called the "Dow Jones Transports") is a U.S. stock market index from the Dow Jones Indices of the transportation sector, and is the most widely recognized gauge of the American transportation sector. Standard & Poor's 500 (SPX) is a basket of 500 stocks that are considered to be widely held. The S&P 500 index is weighted by market value, and its performance is thought to be representative of the stock market as a whole. The S&P 500 is an unmanaged index of widely held stocks that is generally representative of the U.S. stock market. Keep in mind that individuals cannot invest directly in any index, and index performance does not include transaction costs and other fees, which will affect investment performance. Individual investor’s results will vary. The NASDAQ Composite Index (COMP.Q) is an index that indicates price movements of securities in the over-the-counter market. It includes all domestic common stocks in the NASDAQ System (approximately 5,000 stocks) and is weighted according to the market value of each listed issue. The NASDAQ-100 (^NDX) is a modified capitalization-weighted index. It is based on exchange, and it is not an index of U.S.-based companies. The Russell 2000 index is an unmanaged index of small cap securities which generally involve greater risks.
U.S. government bonds and Treasury notes are guaranteed by the U.S. government and, if held to maturity, offer a fixed rate of return, and guaranteed principal value. U.S. government bonds are issued and guaranteed as to the timely payment of principal and interest by the federal government. Treasury notes are certificates reflecting intermediate-term (2 - 10 years) obligations of the U.S. government.
The companies engaged in business related to a specific sector are subject to fierce competition and their products and services may be subject to rapit obsolescence. There are additional risks associated with investing in an individual sector, including limited diversification.
Dividends are not guaranteed and must be authorized by the company's board of directors.
Diversification does not ensure a profit or guarantee against a loss.
Investing in oil involves special risks, including the potential adverse effects of state and federal regulation and may not be suitable for all investors.
International investing involves special risks, including currency fluctuations, differing financial accounting standards, and possible political and economic volatility.
The companies engaged in the communications and technology industries are subject to fierce competition and their products and services may be subject to rapid obsolescence.
Gold is subject to the special risks associated with investing in precious metals, including but not limited to: price may be subject to wide fluctuation; the market is relatively limited; the sources are concentrated in countries that have the potential for instability; and the market is unregulated.
The information contained within this commercial email has been obtained from sources considered reliable, but we do not guarantee the foregoing material is accurate or complete.
Any information is not a complete summary or statement of all available data necessary for making an investment decision and does not constitute a recommendation. Prior to making an investment decision, please consult with your financial advisor about your individual situation.
Charts are reprinted with permission, further reproduction is strictly prohibited.
